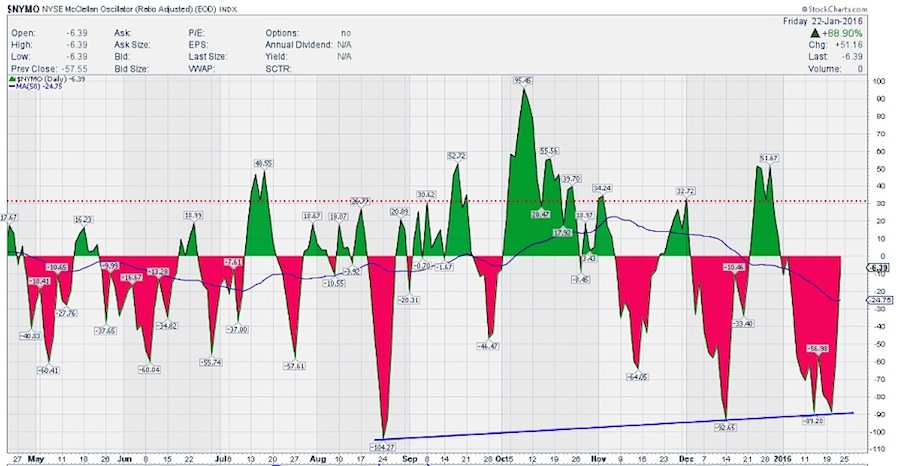
McClellan Oscillator – $NYMO
As mentioned previously, the McClellan Oscillator (NYMO) hit -116 on an intraday basis before finishing the week at -89.20. I look at the intraday levels for short-term stock market price movement (i.e. trading). It will be interesting to see how the McClellan Oscillator acts this week.
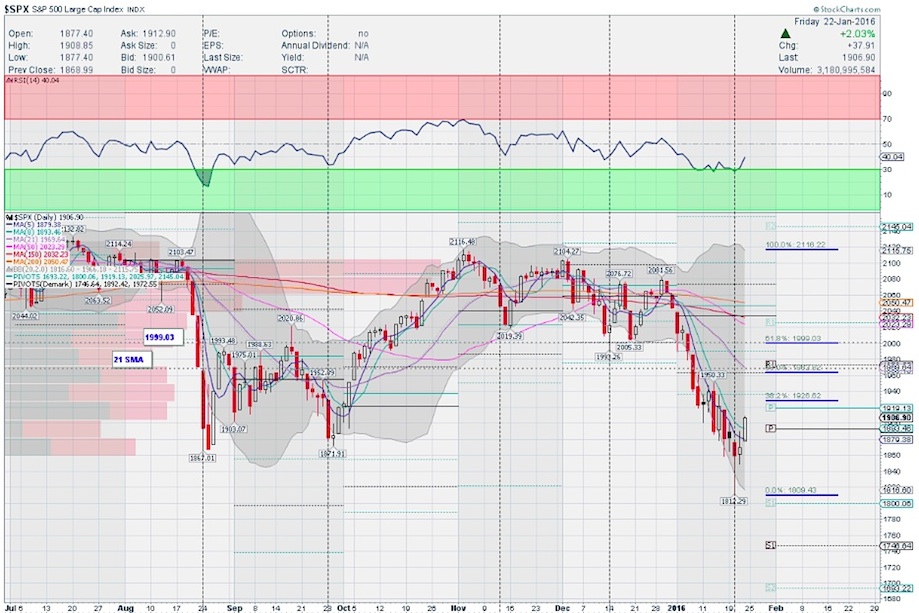
S&P 500 Weekly Update Chart – $SPX
I’m expecting anywhere between a 38.2% Fibonacci retrace to a 50% Fibonacci retrace with a chance of a move towards the 21 day simple moving average. There will likely be plenty of back and filling and choppiness will likely persist.
All the moving averages are sloping lower, so be careful not to get emotionally wrapped up in this move. Follow the price action and support and resistance levels – it will make things easier for you.
Thanks for reading and have a great rest of your week.
Twitter: @sssvenky
The author has a position in S&P 500 related securities. Any opinions expressed herein are solely those of the author, and do not in any way represent the views or opinions of any other person or entity.
")


")
