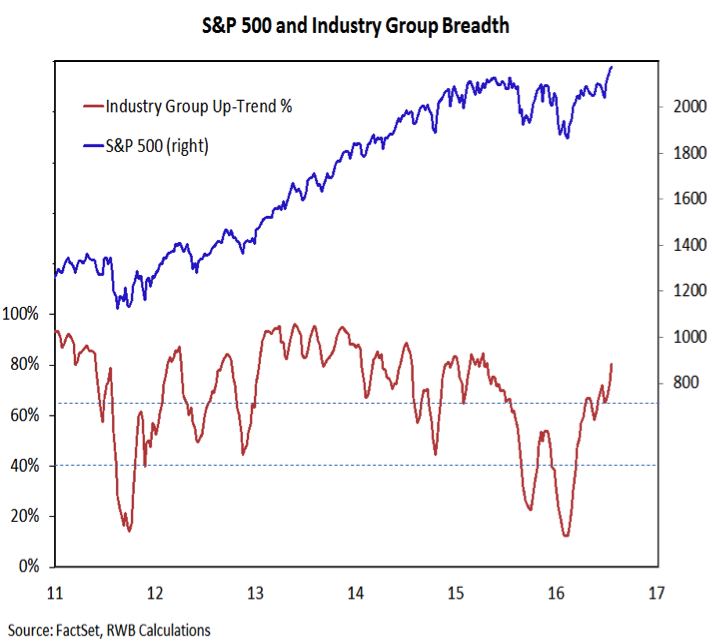
While some near-term trends have cooled, the longer-term industry group trends remain firm. Some 80% of the industry groups in the S&P 1500 are now in up-trends. The behavior of this indicator in 2016 is in sharp contrast to the deterioration that was seen over the course of not only 2015 but 2014 as well (when the pattern of lower highs and lower lows started to emerge). Without a significant change in character, this indicator suggests any pullbacks seen over the near term could limited in degree and duration.
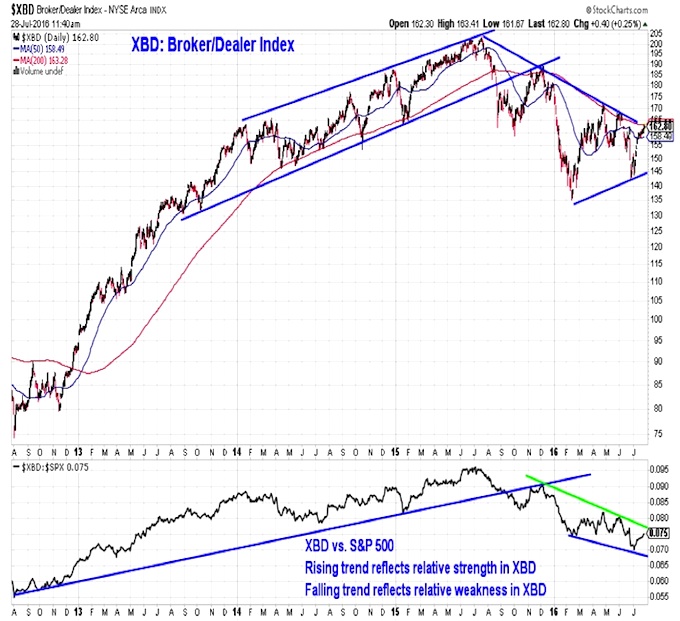
Broker Dealer Index
A clear signal of leadership from the Broker/Dealer index has not yet been seen, but the relative trend line has at least bounced off of its recent low. Both the absolute and relative price lines have rallied toward down-trend resistance. The ability to breakout above these levels would be an important sign of leadership and encouraging evidence of the sustainability of the current rally.
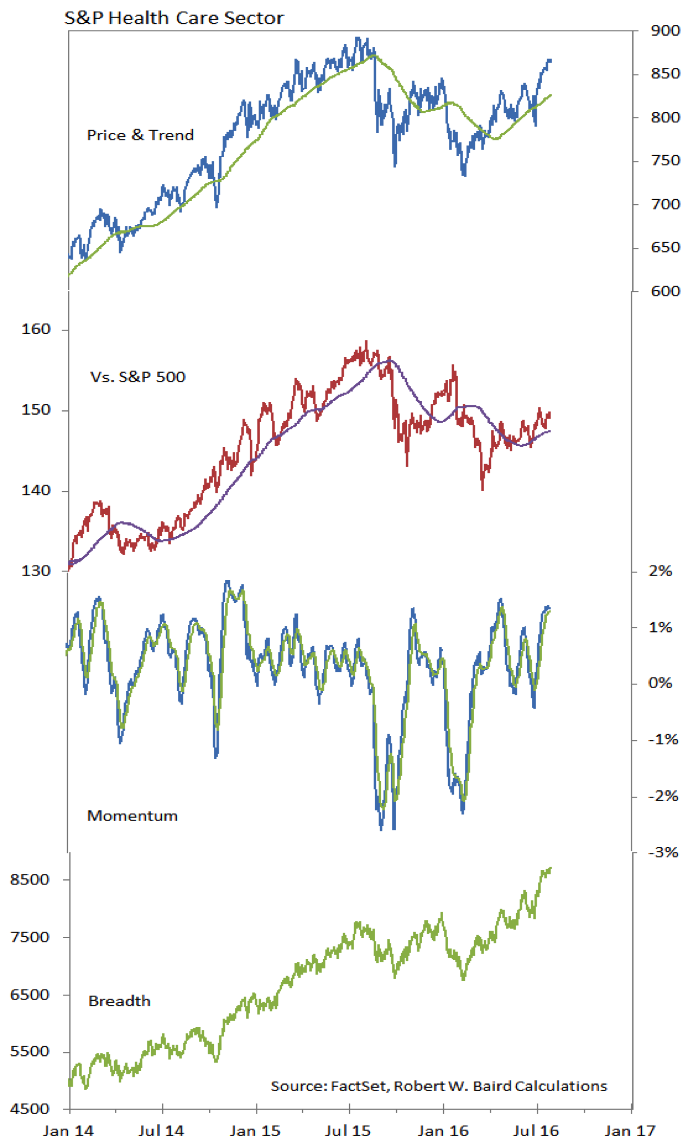
Health Care Sector
The Health Care sector continues to make absolute and relative price progress, although it has not yet returned to the leadership group in our lastest sector-level relative strength rankings. Breadth within the sector continues to advance and momentum has been strong. Encouragingly, biotechs have rallied off of their lows and the Biotech Index has moved above its 200-day average for the first time since mid-2015 (in the process making a higher high).
Thanks for reading.
Twitter: @WillieDelwiche
Any opinions expressed herein are solely those of the author, and do not in any way represent the views or opinions of any other person or entity.


 Ready To Break Out?")