Note that this is an excerpt from Mark’s premium research at Newton Advisors.
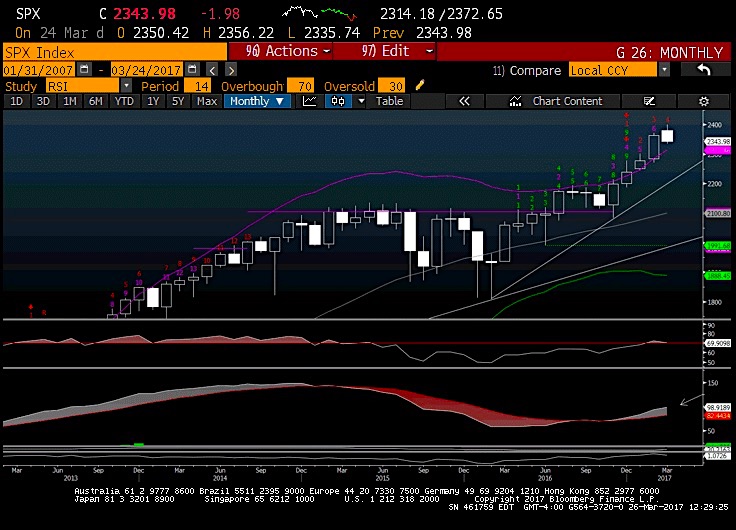
The S&P 500 (INDEXSP:.INX) monthly chart below shows that US markets could possibly experience their first down month of the year after pulling back 0.83% over the first few weeks of March. There are just five trading days remaining.
At current levels, S&P 500 would still close over its upper Bollinger band for the fourth straight month. At the same time, momentum has begun to wane, as shown by the monthly RSI dipping back under 70.
MACD remains positively sloped, but neither MACD, nor RSI have reached levels hit back in 2014 despite the severity of the bounce since last January 2016 lows. Prices look vulnerable to pulling back further, but a move down under the prior months lows will be a necessity before expecting too much of an extension lower. At present, the daily and weekly charts show a few more signs of topping than the monthly, which are giving back just a fraction of February’s gains, albeit in a very extended state.
S&P 500 Weekly Chart
Five more trading days left in the month and Quarter and S&P 500 is down just under 1% for the month, but up nearly 5% for the quarter, thanks to a robust showing in both January and February. The recent bond rally has continued, with yields about 10 bp lower than the prior week, while the US Dollar index has also dropped down to near February lows. Both the 10-Year Treasury Yield (INDEXCBOE:TNX) and US Dollar Index (CURRENCY:USD) were nearly unchanged over the last couple days of the week, attempting to stabilize after the severe pullback in both. Meanwhile, S&P 500 pulled back to multi-week lows for the first time since late December, which at the time proved to be just a one-day affair.
This break in the S&P 500 after a lengthy period of sideways consolidation at the highs looks to be a negative, as it coincided with several different sectors breaking key trendlines from November and a multitude of confirmed Counter-trend sell signals. Breadth and momentum had been tailing off for some time while the indices had managed to absorb the pullback, as several major stocks had been doing most of the heavy lifting. Now index prices are gradually beginning to confirm what momentum and breadth have been suggesting for the last month. We’ve been mentioning this over at our premium Newton Advisory for a while now.
While a few stocks such as Apple (NASDAQ:AAPL), Microsoft (NASDAQ:MSFT) and Facebook (NASDAQ:FB) continue to hold the market up at a higher level than what might be expected otherwise, the trend has been slowly but surely giving way in other sectors and growing increasingly weaker. Heading into the last week of March, there remain definite questions to be answered before expecting an immediate snapback, as trends and momentum remain negative and breadth has been subpar for the last month. At the time of writing, only 31% of all S&P 500 issues were above their 10-day moving average. The key to the market likely still rests with Treasury yields and the yield curve and their effect on Financials, along with Technology, which at present, has shown little to no weakness which has affected the other sectors.
Sector-wise, Technology continues to strong support to the market, holding prices up in resilient fashion as this year’s clear outperformer, higher by nearly 11% through 3/24/17, and outperforming the next best sector, Healthcare, by over 300 bps as the quarter comes to a close. Tech, Healthcare, Utilities, Consumer Discretionary and Consumer Staples are all up 5% or more YTD, the five sectors which are outperforming the SPX. Energy meanwhile, has been a huge laggard, down over 9% YTD, and along with Telecom, is one of the two sectors “DOWN” in performance this year, while Financials are third “worst”, higher by only 1.2% as November/December outperformance came back to Earth. Interestingly enough, the same sectors which are the best performers YTD are also the best performers for the month of March, though Utilities and Tech “take the cake” as the best 1 and 2 of the top 5 and the only 2 sectors positive for the month of March.
Technically speaking, we’ve begun to see some real signs of price deterioration in a few sectors for the first time since the Election. Financials kicked this off early in the month with the pullback following the flattening in the yield curve post FOMC meeting. This group has been the worst performing sector in the rolling one-month period, down 3.43% through 3/24 and still hasn’t shown compelling signs of having bottomed. Other sectors though have joined suit to the weakness in Financials with Healthcare, Consumer Discretionary and Industrials all breaking uptrends from November lows, which looks to be a real warning sign at a time when breadth and momentum have already turned negative.
Meanwhile defensive groups like Utilities have shown strong performance during March, higher by 0.74% and up 1.1% over the last rolling 30-day period. When looking at what to own for the months ahead, the natural tendency is to pick Technology given the strength it’s shown. It’s tough to disagree with this, though a correction would make this much better to buy than at current levels. Utilities meanwhile is a more logical choice for the next few weeks and is preferred to own as yields are dropping and this market correction is ongoing. Analysis and charts of all the major sectors are shown below.
Note that you can catch more trading ideas and market insights over at Newton Advisor. Thanks for reading.
Twitter: @MarkNewtonCMT
Any opinions expressed herein are solely those of the author, and do not in any way represent the views or opinions of any other person or entity.
 Rolling Over At Key Fibonacci Level?")


 Rolling Over At Key Fibonacci Level?")


