In this research note, we will look at some key stock market indicators, the health of the S&P 500 Index (INDEXSP:.INX), and a handful of emerging themes that we are watching in our investing research.
Here are some summary highlights:
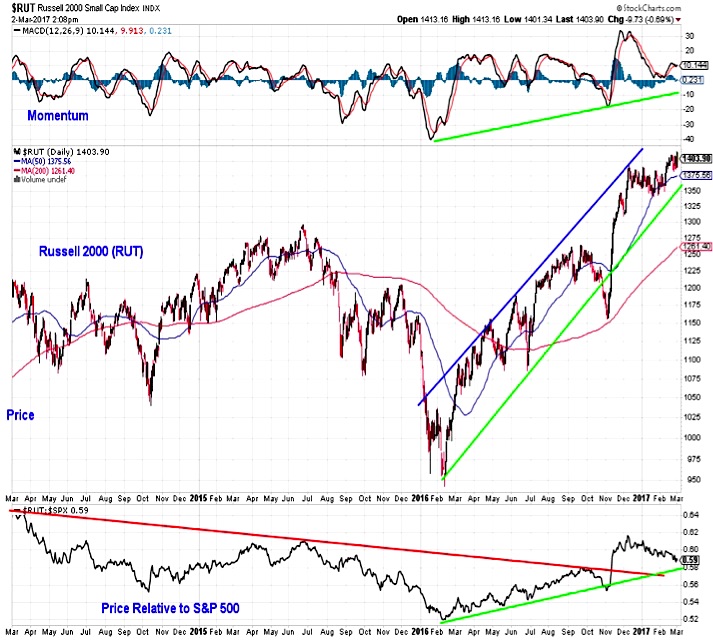
Strength Begets Strength, but Small-Caps Facing a Test – The S&P 500, and most other indexes with it, has surged further into record territory. This strength could build on itself as momentum expands to the upside. Small-caps have also been making new highs and momentum there is also expanding. Since mid-December, however, small-caps have lost ground relative to large-caps and are now facing a test of support on a relative price basis – see Russell 2000 (INDEXRUSSELL:RUT) chart below.
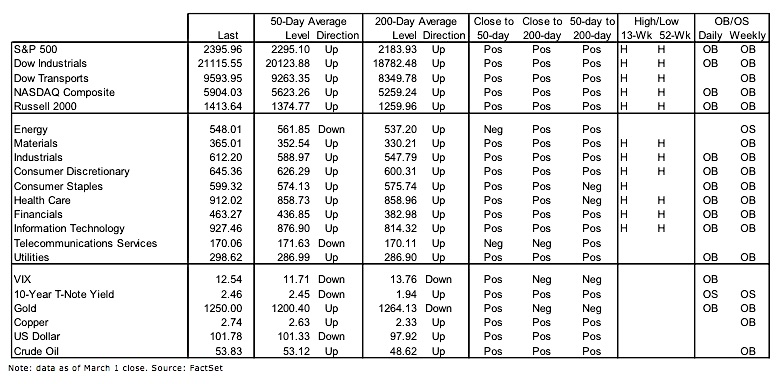
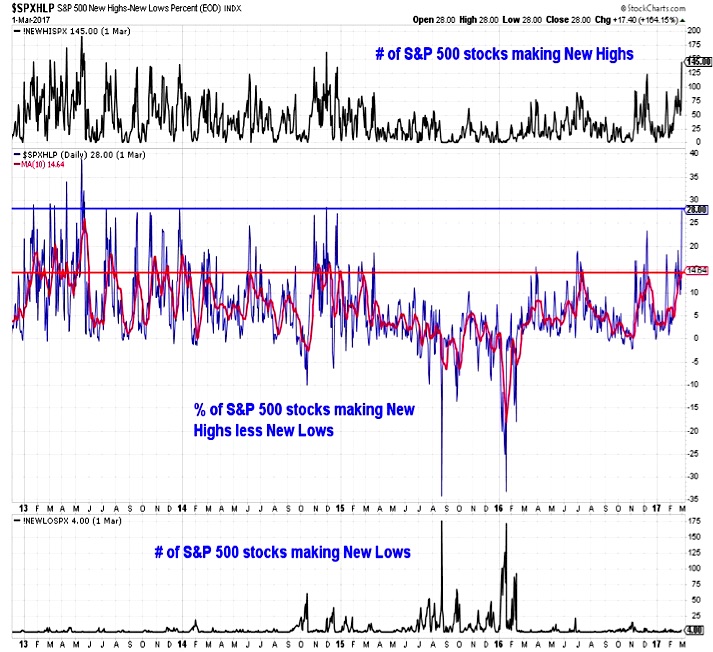
New Highs Reflect Underlying Strength – Strength at the index-level is being echoed at the issue level. The percentage of stocks on the S&P 500 making new highs surged this week. We have also seen a significant up-tick in the percentage of stocks trading above their 200-day averages.
Where to Look for Evidence of Capitulation – While investor sentiment is elevated and excessive by most measures, we are watching two specific areas that remain outliers. The percentage of bulls on the AAII survey remain subdued and despite talk of interest rate hikes and improving economic data, the 10-year T-Note yield remains below its December peak.
Stock Market Indicators
S&P 500 Index
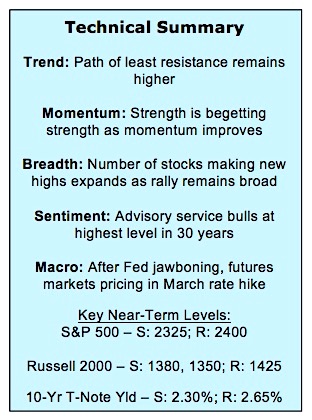
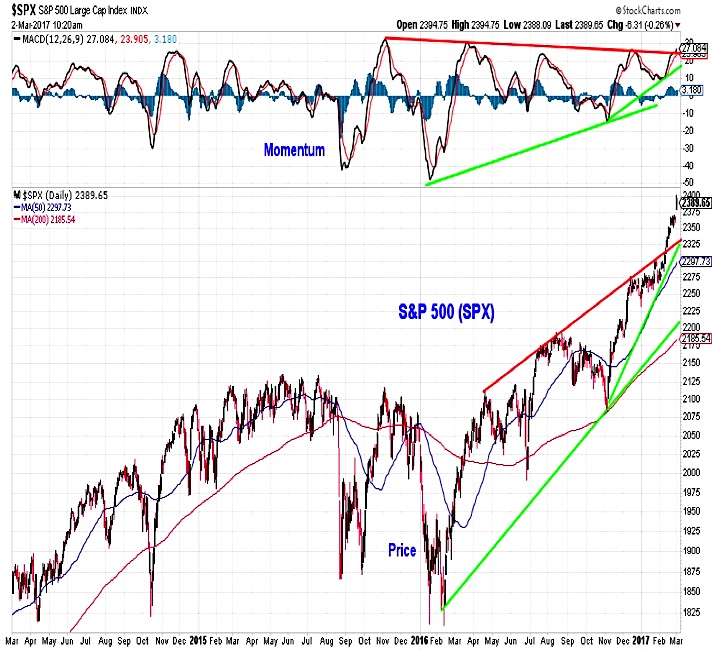
After moving between converging trend-lines, the S&P 500 (INDEXSP:.INX) has broken out to the upside. This move is gaining strength as momentum is also breaking out to the upside. While we seem to be programmed to be scared of new highs, about the most bullish thing stocks can do is go up. That is what they have been doing so far in 2017, and the path of least resistance for now still seems to be higher.
Russell 2000 Index
The small-cap Russell 2000 (INDEXRUSSELL:RUT) is making new highs on an absolute price basis. When looked at relative to large-caps (S&P 500), however, small-caps have given up ground since mid-December. The relative up-trend in small-caps that emerged over the course of 2016 remains intact. The relative price pullback is now approaching trend-line support. If small-caps are going to re-assert leadership, the time to do so may be now.
Market Breadth
It is not just the indexes that are making new highs (although most of them are). Nearly 30% of the stocks on the S&P 500 have made new highs this week. On both a single-day and 10-day basis, the percentage of stocks making new highs has not been meaningfully higher than this week’s readings since the first half of 2013. New highs are also expanding at the sector level – of the 10 sectors we track, six of them are at new highs (versus just one several weeks ago).
continue reading on the next page…


 Flirting With Critical Support… Again")


