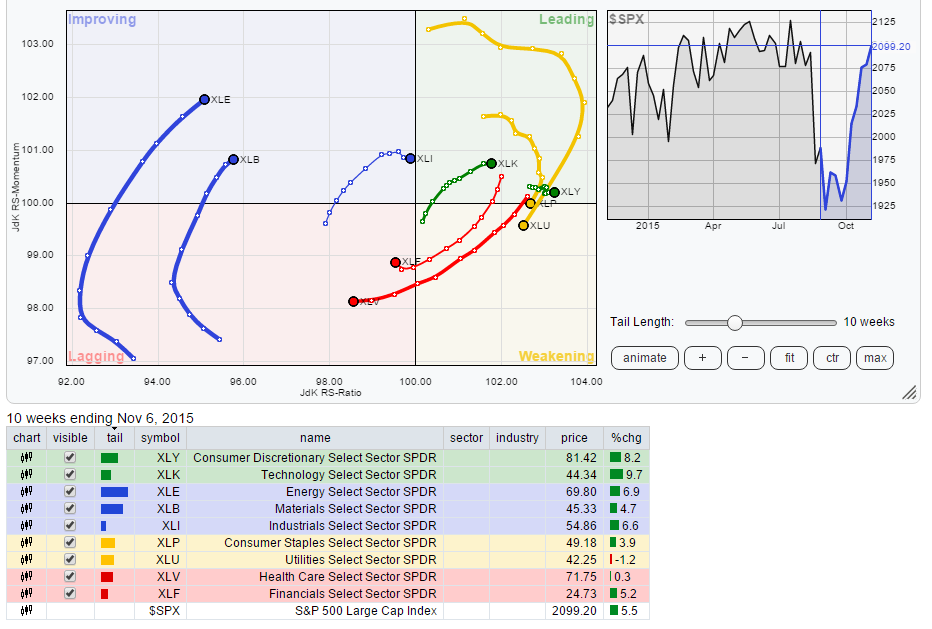
Here is the Relative Rotation Graph (RRG) chart showing the leaders and the laggards among the 9 S&P 500 market sectors.
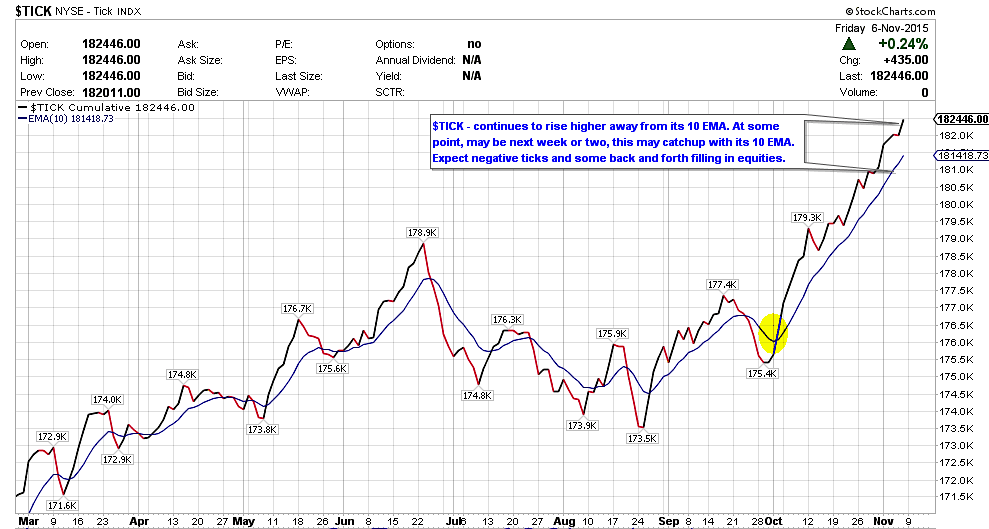
$TRIN & $TICK:
Still not a whole lot of negative ticks during the week except for some seen on Friday.
Having said that, $TICK line is extended extended from the 10 EMA. I’ll be watching to see if this turns lower and crosses 10 EMA or at least tests that line.
$TRIN has been on a mission lately, spiking during the earlier part of the day and cooling off during the latter part of the day. It finished the week at 0.78. If we were to pause around here, watch if $TRIN spikes over 2.00 or 3.00.
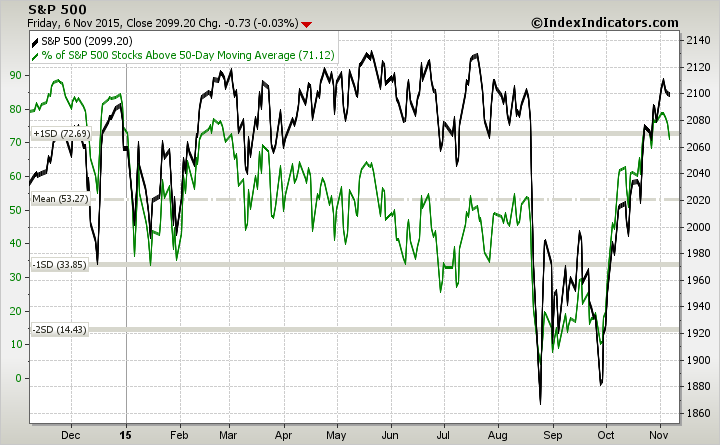
% of S&P Stocks Above 50-Day Moving Average – 71.12. Was 76.10 last week. (No longer overbought)
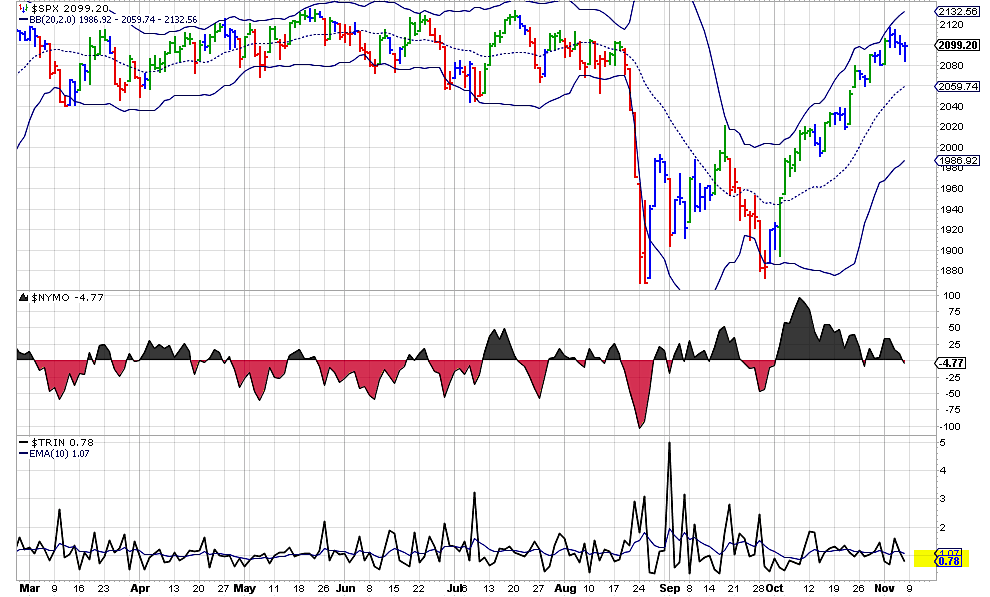
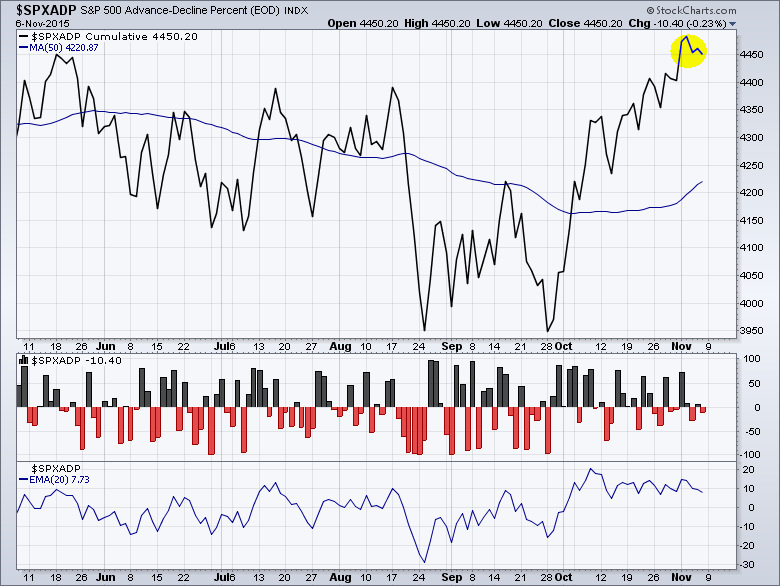
$SPXADX – Advance-Decline Data:
The Triple view of the Advance Decline data for $SPX. The Advance Decline Line continued higher last week but it has started to turn lower on the Daily timeframe while on the weekly, it continues higher. If both daily and weekly Advance-Decline lines fail to make new highs, that can signal a big caution for the stock market participants. Additionally, the NYSE Advance-Decline line is well below its 2015 high and a possible negative divergence.
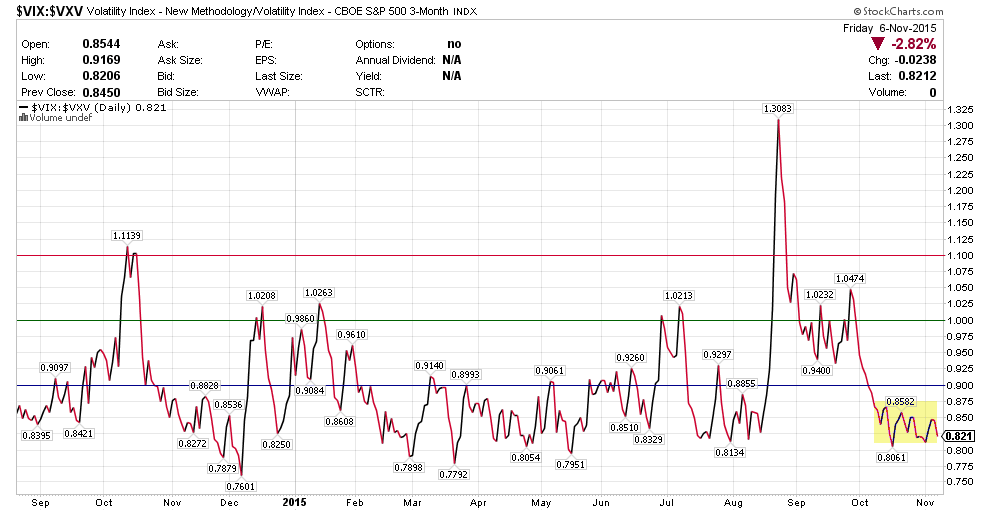
$VIX:$VXV:
$VXV is the 3 month volatility index. The relationship between $VXV and $VIX (30 day volatility) or the ratio between them if > 1.00 often spells trouble for equities. This ratio is back lower and ended at 0.821. Will be watching it closely to see if there are any big pops higher which may mean some caution for stocks.
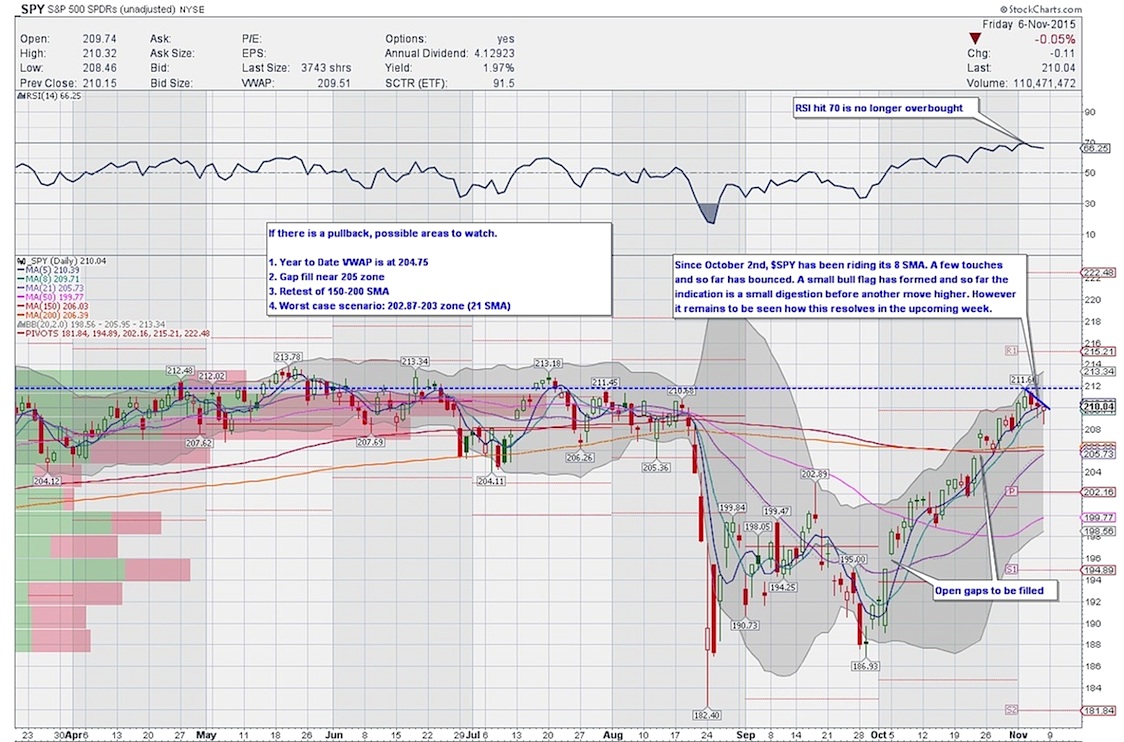
S&P 500 ETF – $SPY DAILY TIMEFRAME:
On a Daily Timeframe, the S&P 500 ETF (SPY) started the week higher negating Friday’s candle, quite similar to the move on October 21st. On Tuesday, it continued higher but on Wednesday it printed what is called a Dark Cloud Cover and needed confirmation lower on Thursday. After slightly higher on Thursday, price quickly went lower and confirmed the Dark Cloud Cover candle. On Friday, it pulled back sharply lower after NFP but ended the day with a possible Hangingman Candle which will need confirmation lower on Monday. Be aware, though, this could also be a part of a bull flag.
Momentum indicators are still bullish. RSI has worked off the overbought conditions and is still very much in bullish zone consolidating. MACD has started turning lower towards the lower line. A cross lower looming? Possible and something to watch out for. Slow STO though is overbought and embedded. It is showing signs of a possible pause.
$SPY has been riding the 8 SMA since October 2nd and that’s something noteworthy while if notice closely, the 21 and 50 SMA has turned up already. Nothing bearish here at least as yet.
Conclusion:
The market is not showing any signs of pause and continues to melt-up towards All Time Highs. A move higher out of the bull flag to retest last week’s highs and a failure there could mean a short term double top. With the Volatility Index $VIX being subdued, I expect to see sideways rangebound action on the S&P 500 between 2060-2120 before any meaningful move higher or even a year-end rally – especially if a pullback should occur in the next couple of weeks which are seasonally soft. Of course, there is a possibility of a deeper pullback towards 2040 or 2020 if need be. In my opinion, any pullback will provide some a great buying opportunity. This is not a time to be greedy and chase but rather a time to harvest profits.
Thanks for reading and have a great week.
Twitter: @sssvenky
The author has a net long position in S&P 500 related securities. Any opinions expressed herein are solely those of the author, and do not in any way represent the views or opinions of any other person or entity.

: Showing Some Signs of Emerging Strength")
