In this investing research note, we will analyze key stock market indicators, weigh the health of the S&P 500 Index (INDEXSP:.INX), and discuss old and new themes that we are watching in our investing research.
Here are some summary highlights:
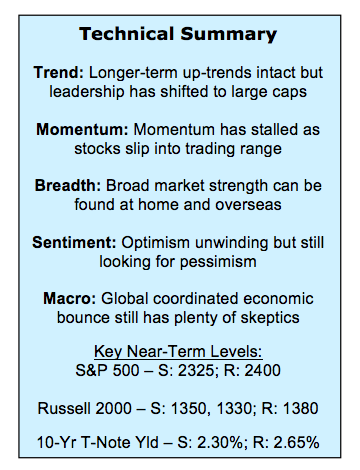
Rally Needing a Reset – Daily and weekly momentum indicators have turned lower and rally participation has narrowed as stocks have slipped into consolidation mode. This provides the cyclical rally that began just over a year ago a chance to catch its breath and build a stronger base from which the next leg higher can emerge. If this consolidation comes with an unwind in optimism and continued strong breadth trends, it could be the proverbial pause that refreshes.
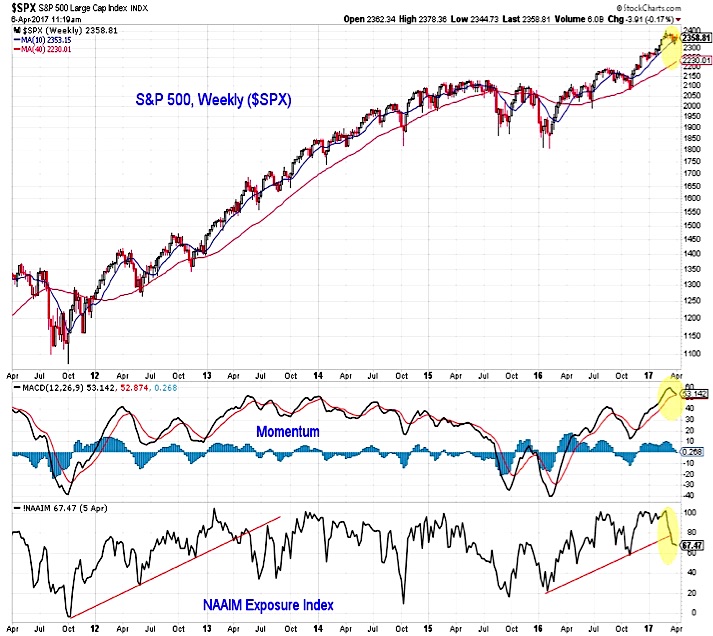
Looking for Optimism to Unwind – After surging to some of their highest (most optimistic) readings ever in early March, the NAAIM and Investors Intelligence surveys in recent weeks show an unwinding in optimism, even if outright pessimism has not yet been seen. It is too early to suggest an ”all-clear” from the sentiment data, but it is heading in the right direction.
Near-Term Breadth Has Stalled – Long-term trends suggest the broad market remains on healthy footing. Our industry group trend indicator shows that most areas of the market remain in up-trends and a similar percentage of stocks are trading above their 200-day averages. Shorter-term breadth indicators, however, remain out of gear.
Stock Market Indicators

S&P 500 Index
While stalling momentum could lead to further consolidation on the S&P 500, the longer-term trend remains intact. Encouragingly, the momentum reset is coming with an unwinding in investor optimism. While this could mean more volatility in the second quarter than was experienced in the first quarter, it also suggests this could be a pause that refreshes on the way to higher highs later this year. While near-term support on the S&P 500 is near 2325, a move toward the 40-week average (currently near 2230) could be what it takes to see a meaningful spike in pessimism.
S&P 500 – Market Breadth & Industry Trends
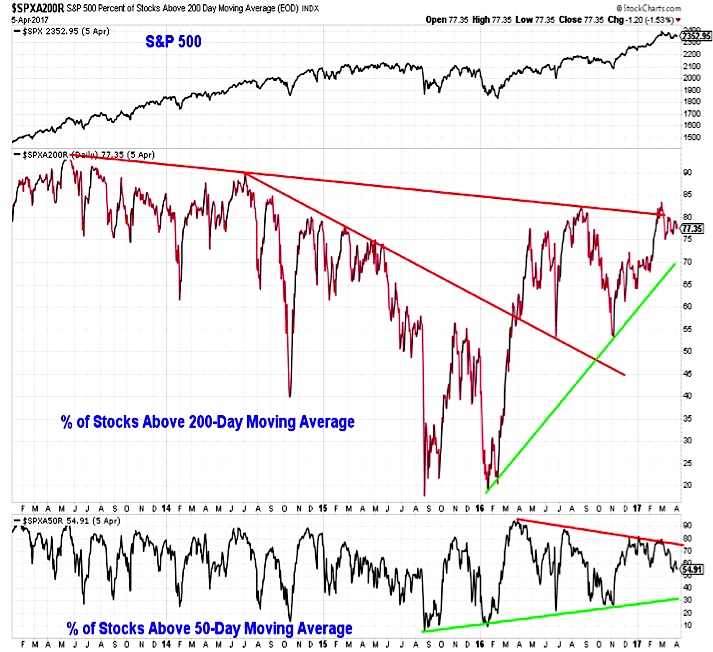
While an unwinding in optimism is welcome, if the ongoing consolidation does meaningful damage to longer-term breadth trends it could be more problematic. So far that has not been the case. While short-term breadth trends are heading toward a reset, longer-terms trends remain strong. One way to view this dichotomy is to compare the percent of stocks trading above their 200-day average versus those above their 50-day average. More than 75% of stocks on the S&P 500 are trading above their 200-day average, but only 55% are above their 50-day average. If the 50-day percentage could drop toward 30% while the 200-day percentage remains above 70%, the seeds for a rally (a near-term oversold condition in the context of a longer-term up-trend) could be sown.
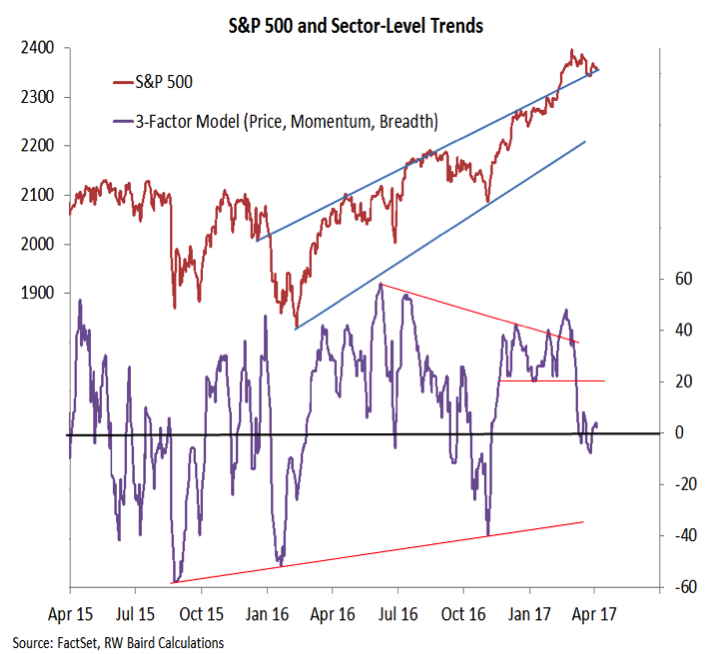
For now, we are not seeing evidence that there is meaningful upside potential for stocks. While the S&P 500 has stalled rather than sold-off, sector-level trends for price, breadth and momentum have seen a meaningful deterioration. Sector-level strength is not nearly as strong as they were when the S&P 500 was consolidating the first leg of the post-election rally.
continue reading this article on the next page…


