In this week’s investing research outlook, we analyze the current trend of the S&P 500 Index (INDEXSP:.INX), key stock market indicators, and discuss emerging themes and news that we are watching closely in our investing research.
Here’s a summary of our findings for the week ending June 2, 2017:
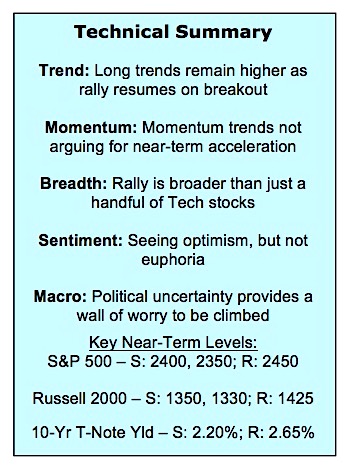
Support Holds; Resistance Folds – There are a variety of ways to characterize an up-trend. One that seems apropos of late is the pattern of support holding and resistance folding. The effect has been that pullbacks on the S&P 500 have been limited and it has moved further into record territory even as momentum has cooled in 2017.
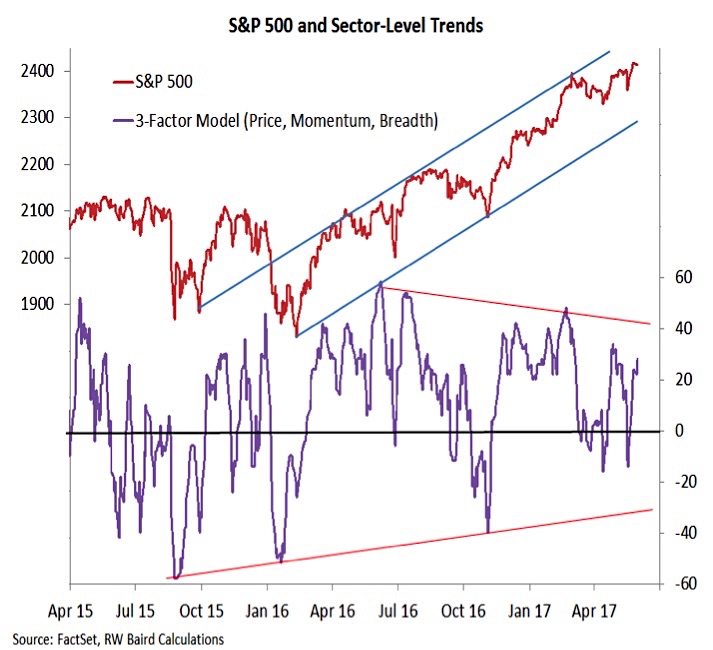
Sector-Level Trends Improving – A popular narrative right now is that the market is being supported by just a few large-cap (mostly Tech) stocks and this poses a risk for the overall market. Looking beneath the surface, most sectors are making new highs and sector-level trends are turning higher. This is evidence that domestic breadth trends are improving and the popular averages continue to enjoy support from the broad market.
Sentiment Shows Optimism Mixed With Skepticism – Advisory services and active investment managers continue to show elevated levels of optimism (although a bit less than last week and shy of euphoria). Individual investors, according to AAII, are more bearish than bullish, although mostly they are neutral. Options data shows a healthy and rising demand for put options – evidence of skepticism even as stocks rally.
Stock Market Indicators:
S&P 500 Index
While momentum on the S&P 500 stalled in the first quarter, the index has continue to grind out gains. March and April were characterized by both support and resistance holding steady. As we have moved toward summer, support has continued to hold and it is resistance that we have seen fold. That has cleared the way for the S&P 500 to make new highs and reinforces the view that the path of least resistance remains higher.

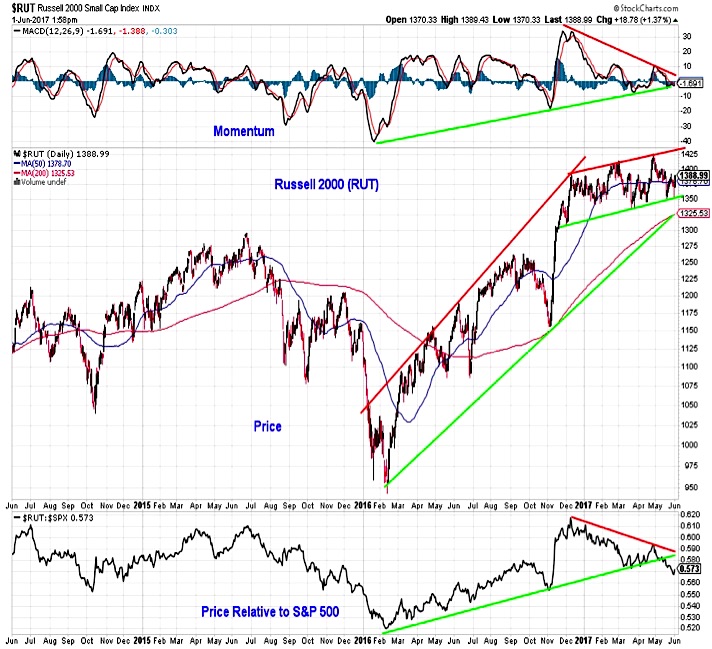
Russell 2000
Despite concerns to the contrary, the S&P 500 is not alone on an island. Small-caps via the Russell 2000 Index (INDEXRUSSELL:RUT) have struggled relative to large-caps in 2017 (the bottom clip shows the performance of the Russell 2000 to the S&P 500). On an absolute basis, however, the Russell 2000 remains in an up-trend on both a price and momentum basis. In fact the momentum up-trend for the Russell 2000 off of the 2016 lows remains intact, while it has been broken for the S&P 500.
Dow Jones Transportation Index
The Dow Transports are also still in an up-trend from both a price and momentum perspective, even though they have lost ground to the Dow Industrials on a relative price basis in 2017. After holding support at the 200-day average, however, the Transports have rallied strongly and are testing resistance on both an absolute and relative price basis.
![]()
Market Breadth
The examples of Small-caps and the Dow Transports can be expanded to sector-level trends. This week we have seen six of 10 cap-weighted sectors making news highs, with a potential seventh less than 1% away from its high. From an equal-weight perspective, the equal-weight S&P 500 has moved to a new high and seven of nine equal-weight sector ETF’s are within 1% new highs. In other words, while there is evidence that a handful of large-cap stocks are pacing the market, they are not the only thing holding up the market at this point. Our sector-level model that looks at price, breadth and momentum trends has improved sharply over the past two weeks, and could provide support for further strength in the S&P 500.
CONTINUE READING ON THE NEXT PAGE…

: Showing Some Signs of Emerging Strength")

