S&P 500 Breadth Indicators
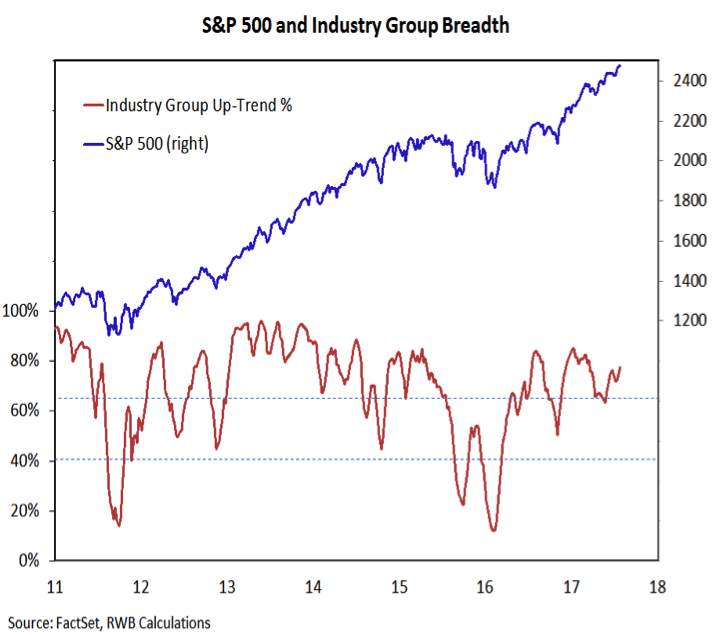
Better than three-quarters of the industry groups in the S&P 1500 remain in longer-term uptrends.
While this is shy of the 90%+ readings seen in 2013 or even the 85% that was seen at the beginning of this year, this indicator has remained elevated and is again expanding. This suggests while a pullback on the indexes may be overdue, protracted weakness does not appear likely at this point.
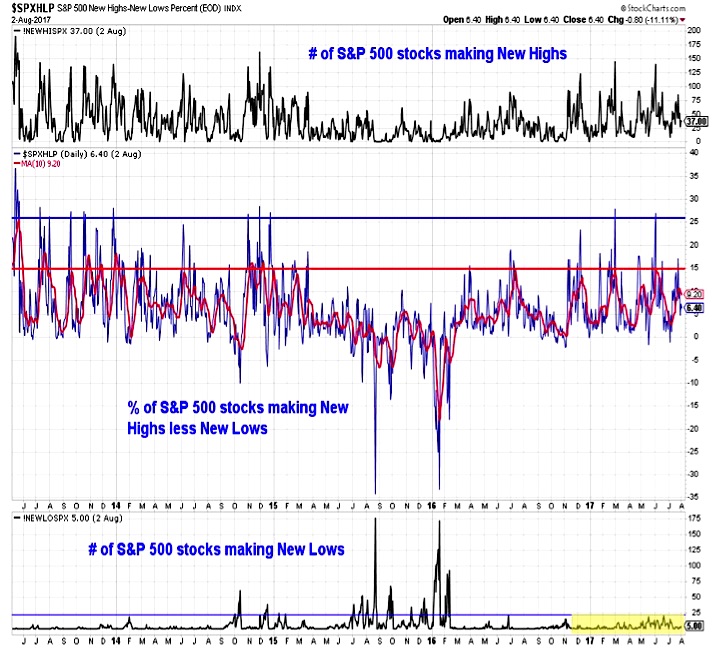
While the longer-term breadth trends are positive, we are watching several short-term breadth indicators closely for evidence of deterioration. The number of stocks joining the indexes in making new highs has been paltry. The good news here is that there have been relatively few stocks making new lows – an expansion in that list would be worth noting.
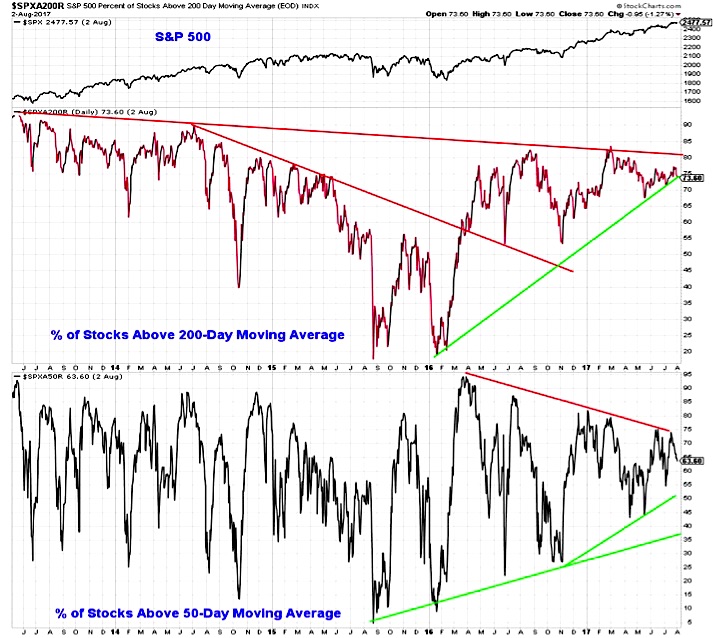
Neither the percentage of stocks trading above their 200-day averages nor the percentage trading above their 50-day averages has been able to break the pattern of lower highs that has emerged. The good news here is that the pattern of higher lows is still intact as well. If that changes, it could suggest that rally participation has narrowed enough to increase the risk of a meaningful pullback on the S&P 500.
S&P Financials Sector
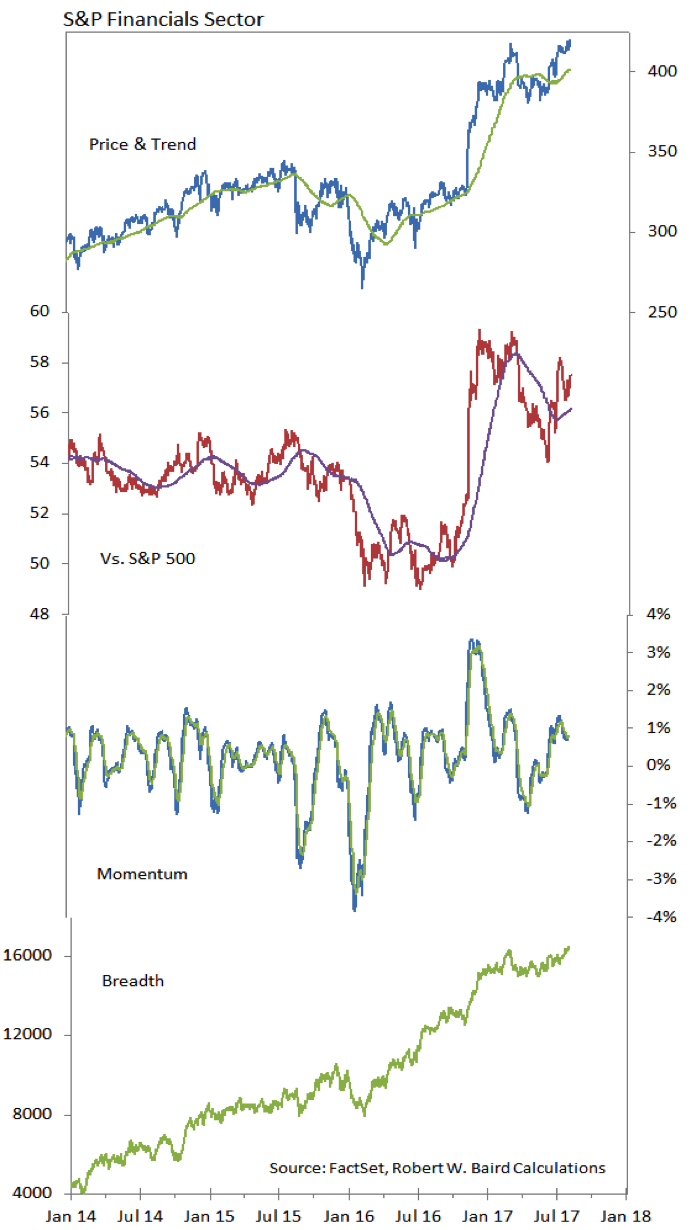
The Financials sector has yet to make new highs relative to the S&P 500, but it has joined the leadership group on our sector-level relative strength rankings. The sector has seen new price and breadth highs, while the recent upswing in momentum may be cooling.
Thanks for reading.
Twitter: @WillieDelwiche
Any opinions expressed herein are solely those of the author, and do not in any way represent the views or opinions of any other person or entity.


