The U.S. stock market indexes have been grinding higher.
The S&P 500 (NYSEARCA:SPY) should face some headwinds this week, however.
S&P 500 Cycle Outlook for the Week of September 24, 2018:
– The stock market rose last week, with the S&P 500 (SPX) up 25 points to 2930, an increase of 0.9%.
– Trump implemented tariffs on $200 billion in imports, but China responded with tariffs on only $60 billion of US imports, which help lift stocks.
– Our projection this week is for the SPX to trade in a choppy range, with downside risks increasing.
After the markets closed on Monday, President Trump announced that the US would impose a 10% tariff on the import of $200 billion worth of Chinese goods. Trump also said the rate of the tariff would increase to 25% on January 1.
While the Chinese government did respond, they did so by imposing 5-10% tariffs on only $60 billion in US imports. After the announcement, news reports emerged that China was considering lowering import tariffs on the majority of its trading partners.
While Premier Li Keqiang confirmed that tariff reductions were being planned, he did not provide additional details. In any case, this appears to be an attempt to simulate the slowing Chinese economy, while minimizing the benefits to the US.
Stocks surged on Tuesday, after the markets realized that the Chinese response would not be “tit-for-tat”, They surged again on the reports of a possible reduction in tariffs.
In addition to the S&P 500 finishing higher on the week, the NASDAQ finished flat and the Russell finished lower. Beyond the US, the Vanguard World Stock Index finished 1.8% higher, and the MSCI Emerging Markets Index (EEM) finished 3% higher.
The sentiment appears to be that the trade war may not be as bad as some had imagined.
On the macro side, while building permits and existing home sales came in low, the Philadelphia Fed Manufacturing Index outperformed. Yet in Europe, German Manufacturing PMI came in below expectations.
S&P 500 (SPX) Daily Chart
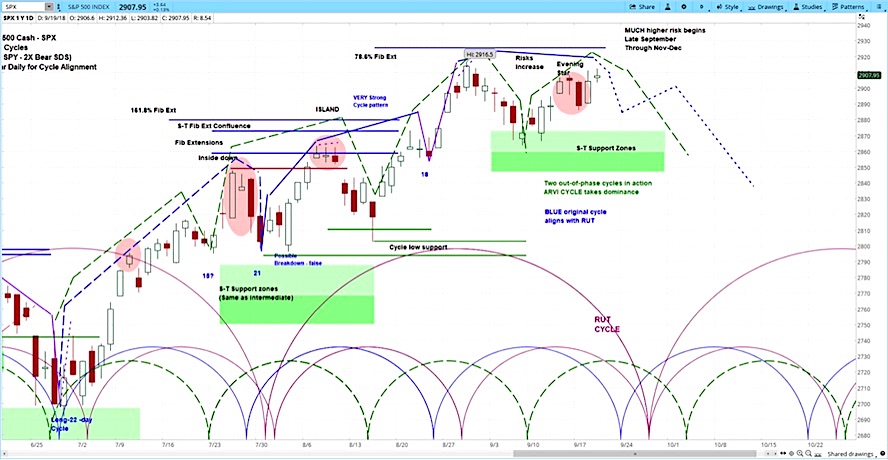
Our analysis for the coming week is for the S&P 500 (SPX) to trade in a choppy range, setting the stage to begin to roll over. The purple brackets in the chart above represent a shifted cycle for the Russell 2000, which will provide some downside pressure, as the cycle ends this week.
The dotted green brackets represent the SPX minor cycle. We expect the SPX to begin the declining phase for the current cycle this week. Our near term target is the support zone between 2900-2911. Beyond this week, we see intermediate term risks increasing.
For more from Slim, or to learn about cycle analysis, check out the askSlim Market Week show every Friday on our YouTube channel.
Twitter: @askslim
Any opinions expressed herein are solely those of the author, and do not in any way represent the views or opinions of any other person or entity.


