In this week’s investing research outlook, I will analyze the current trend of the S&P 500 Index (INDEXSP:.INX), check in on market breadth and investor sentiment indicators, and discuss current themes and news that we are watching in the financial markets.
Here’s a summary of our findings for the week ending October 13, 2017:
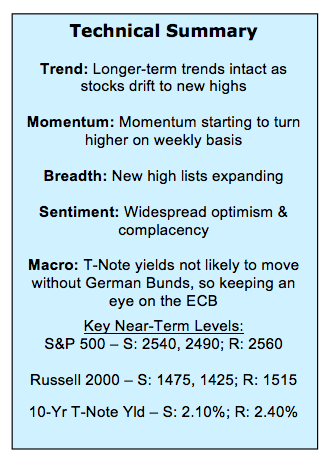
Breadth Indicators Improving – The S&P 500 has been grinding out new highs and momentum is even starting to turn higher. Helping support the gains at the index level have been improving trends at the individual stock level. The percentage of stocks trading above their 50-day average has jumped to nearly 75% (moving just ahead of the percentage of stocks trading above their 200-day average) and the number of stocks making new 52-week highs is expanding.
Excessive Optimism Could Limit Near-Term Upside for Stocks– While price and breadth trends are improving, we are seeing widespread evidence that investor optimism is excessively high. This can be seen most acutely in the Investors Intelligence data, which this week shows four times as many bulls as bears. This may not derail the stocks from a path higher over the course of the fourth quarter, but could make gains hard fought and could open the door to some near-term weakness.
Watching Copper & Bund Yields for Clues About Treasuries – After a brief pullback, copper prices are moving higher again. If the pattern of the past few years is intact, this could put upward pressure on Treasury yields. The wild card may be German Bund yields and any news from Draghi or the ECB about a shift from quantitative easing to tightening.
Stock Market Indicators:
S&P 500 Index
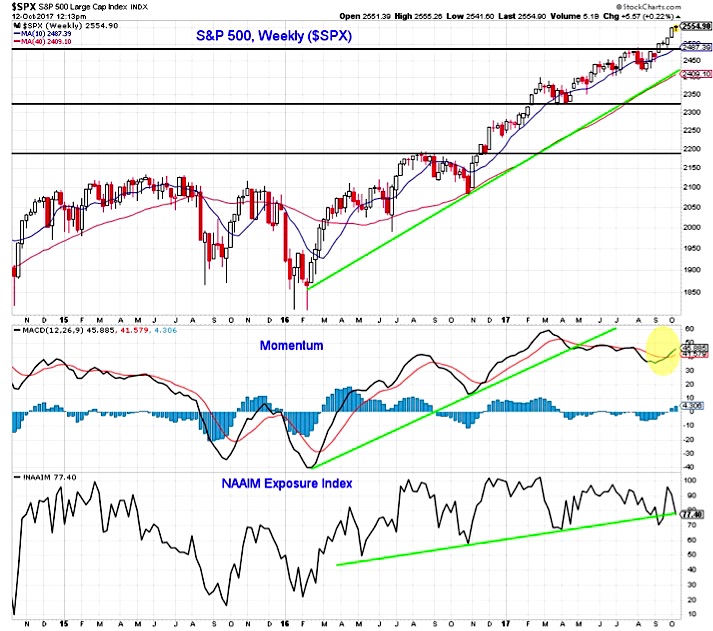
The S&P 500 has stretched further into record territory as the price trend that emerged off of the early 2016 lows has remained intact. Weekly momentum has turned higher after moving lower since its Q1 peak. A sustained up-turn in momentum could help reinforce recent price gains. Also worth watching on this chart is the drop in the NAAIM Exposure index. This sentiment index has trend higher over the course of the current cyclical bull market, but has been making lower highs. A protracted move lower would represent a reversal in sentiment that could open the door to stock market weakness.
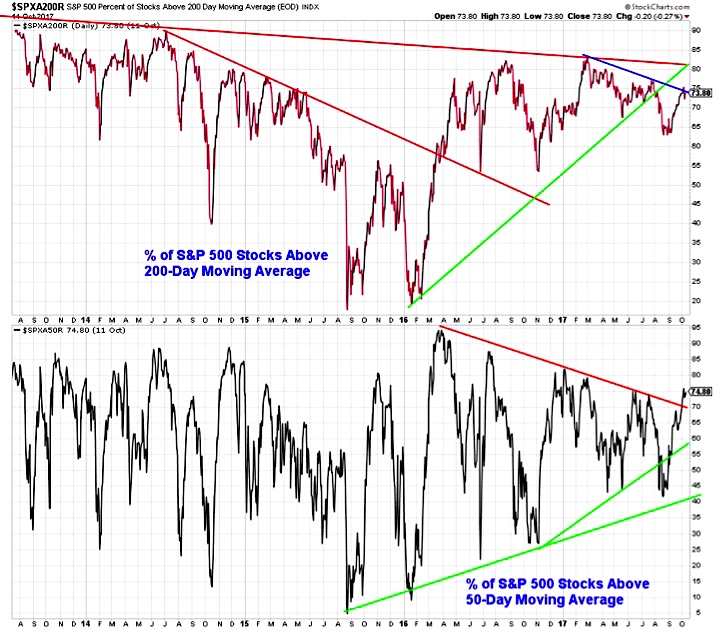
Not only has momentum picked up at the index level, but breadth trends are improving as well. The percentage of stocks above their 50-day average has expanded from 40% in August to now nearly 75%. This breaks the pattern of lower highs that had emerged and could support index-level gains moving into year end. One caveat is that the improvement in the percentage of stocks trading above their 200-day averages has been more modest, the pattern of lower highs (and lower lows) seen since early 2017 has not yet been broken.
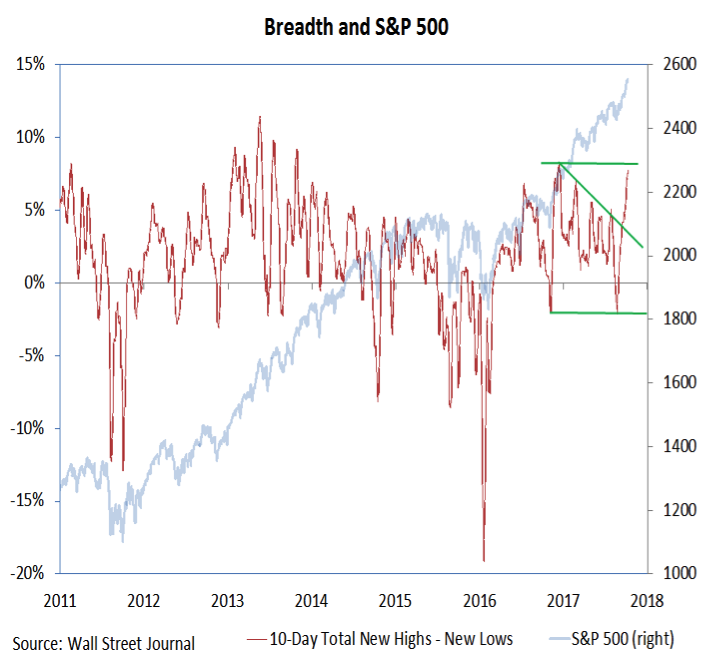
The number of stocks making new 52-week highs has expanded since its mid-August lows. On a 10-day net basis (new highs less new lows), we are seeing the best rally participation since late last year. The pattern of lower highs has been broken, but this indicator could be approaching resistance at the December peak.
continue reading on the next page…


