The S&P 500 price movements over the past several weeks highlight the risks of a volatile trading environment for traders.
During this period of correction and consolidation, the stock market is bounced around by political news and fast moves.
We still see the stock market to be in a declining phase, one that should see weakness this week before, perhaps, a late week rally. Let’s review and discuss more in-depth.
S&P 500 Analysis and Market Cycle Outlook:
- The stock market fell last week, with the S&P 500 (SPX) down 34 points to 2752, a decline of 1.2%.
- President Trump appointed Mike Pompeo as Secretary of State and Larry Kudlow as Director of the National Economic Council.
- Our projection this week is for stocks to continue to fall with the declining phase of their current market cycle, followed by a bounce towards the end of the week.
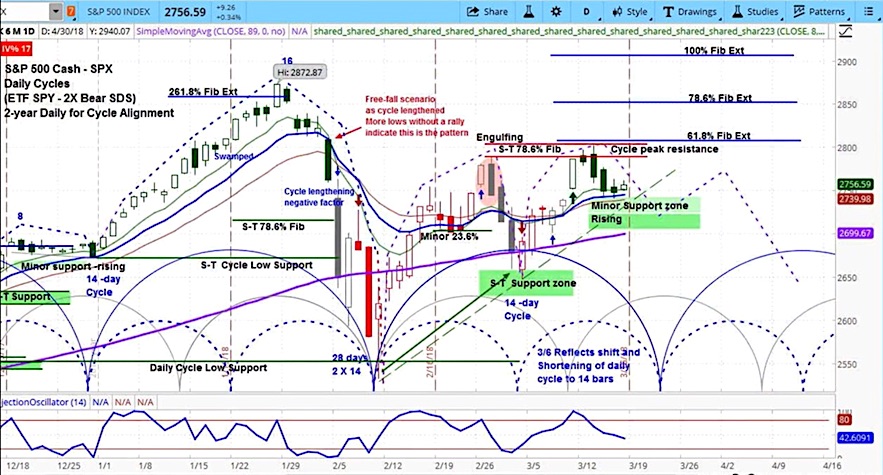
S&P 500 (SPX) Chart with Daily Bars
On Monday, the Atlanta Fed revised its GDP estimates for the first quarter down 0.3% to 2.5%. As well, concern continued to grow over the economic impact of import tariffs, which pushed manufacturing stocks lower.
On Tuesday, the Bureau of Labor Statistics announced that the Consumer Price Index had risen 0.2%, which is in line with expectations. Also, President Trump announced that he would replace Secretary of State Rex Tillerson with CIA Director Mike Pompeo, with whom he has more agreement on international affairs.
On Wednesday, the Commerce Department announced that retail sales fell in February for a third consecutive month. This may lead to further revisions for Q1 GDP estimates.
On Thursday, President Trump announced TV personality Larry Kudlow as his selection for Director of the National Economic Council. Kudlow later warned that the Federal Reserve should not raise rates too quickly, saying of the economy, “Just let it rip, for heaven’s sake.”
On Friday, the Federal Reserve reported that industrial production rose by 1.1% in February. This is the strongest increase since October 2017, far exceeding the expectations of 0.5%.
Our approach to technical analysis uses cycle analysis to project price action. The semicircles on the daily chart above represent the short-term market cycles. Our projection for the S&P 500 (SPX) in the coming week is for a move lower as stocks continue the declining phase of their current market cycle, with support at 2722. This decline will be followed by a bounce towards the end of the week.
For an introduction to cycle analysis, check out a clip of our Big Picture Analysis. To see the full version, visit askSlim.com and become a free Level 1 member.
For more on our analysis, check out the askSlim Market Week below – the latest episode is below.
Our latest askSlim Market Week Video:
Twitter: @askslim
Any opinions expressed herein are solely those of the author, and do not in any way represent the views or opinions of any other person or entity.


")


