The S&P 500 recovery rally hit a wall last week as stocks declined sharply.
Stock market volatility is likely to linger into this week as the correction phase of this decline continues to take shape.
Our market cycles point to a test of last week’s lows (or undercut) before another bounce higher.
S&P 500 Analysis and Market Cycle Outlook:
- The S&P 500 moved lower last week, declining by 2.4%.
- Markets declined mid-week on the perception that the new Fed Chair may be more hawkish than anticipated.
- Then President Trump’s proposal on trade initially pushed markets lower but they partially recovered by Friday’s close.
- Our projection this week is for stocks to decline to 2630 and then rebound once the rising phase of the next minor cycle begins.
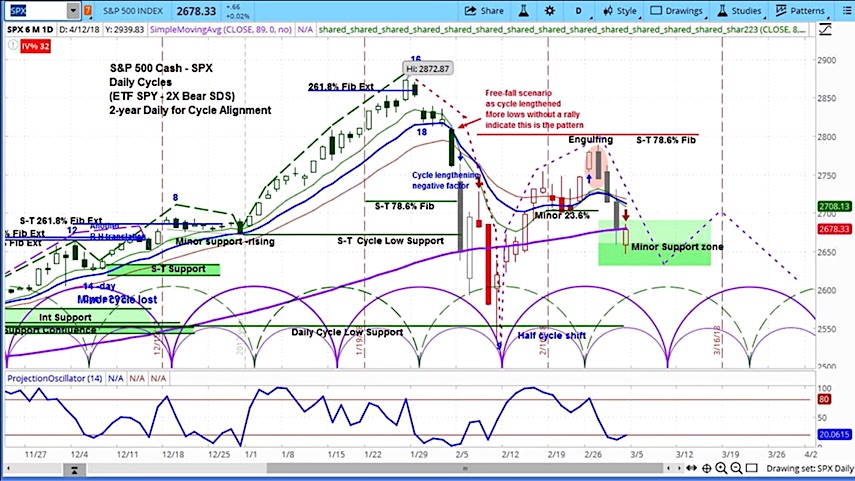
S&P 500 (SPX) Chart with Daily Bars
The stock market fell last week, with the S&P 500 (SPX) down 66 points to 2691 as the correction phase continues.
On Monday, Warren Buffett referred to Apple (AAPL) as an “extraordinary consumer franchise” and announced that Berkshire Hathaway (BRK.A), had acquired “more Apple than anything else” over the last 12 months. This pushed AAPL to a new intraday all-time high, later closing just under its all time high closing price. However, that was the last of the froth in which the markets would engage for the remainder of the week.
On Tuesday, Jerome Powell, the new Chair of the Federal Reserve, made the first of two Congressional appearances for the annual Humphrey-Hawkins hearings. Before the House Financial Services Committee, he testified that if the economy overheats it was possible that the Fed may increase rates faster than expected.
By the end of the day, traders had bid up the probability of a Q4 rate hike to over 50%. As higher interest rates could pose an economic headwind, this pushed stocks lower, with the SPX declining by 1.3%. This weakness continued into Wednesday, with a dramatic drop into the close. This was perhaps anticipating more hawkish comments from Powell during the forthcoming hearing before the Senate Banking Committee.
On Thursday, stocks opened lower and bounced around during Powell’s testimony, during which he provided reassurance that there was currently no “decisive” evidence of wage inflation or economic overheating. However, in an ad hoc news conference President Trump announced plans to impose tariffs of 25% on steel imports and 10% on aluminum. This led to another leg lower for the stock market.
On Friday, stocks around the world retreated on concerns about a possible global trade war. Trump later tweeted that “trade wars are good and easy to win.” The US markets opened lower, but recovered to close higher, perhaps in doubt that the administration would follow through on threats, that may have appeared to some observers, as cobbled together.
Our approach to technical analysis uses cycle analysis to project price action. The purple semicircles on the daily chart above represent the short-term market cycles.
Our projection for the S&P 500 (SPX) in the coming week is for a move lower as stocks continue the declining phase of their current market cycle: the bottom of our support zone is 2630. Once the rising phase of the next cycle begins, perhaps on Wednesday or Thursday, the market will likely rebound.
For an introduction to cycle analysis, check out a clip of our Big Picture Analysis. To see the full version, visit askSlim.com and become a free Level 1 member.
Our latest askSlim Market Week Video:
Twitter: @askslim
Any opinions expressed herein are solely those of the author, and do not in any way represent the views or opinions of any other person or entity.


: Showing Some Signs of Emerging Strength")
