The S&P 500 (NYSEARCA:SPY) fought off bearish headwinds to close the week higher by +0.5%.
This has the Bulls feeling pretty good… however, bearish cycles are still in play near-term.
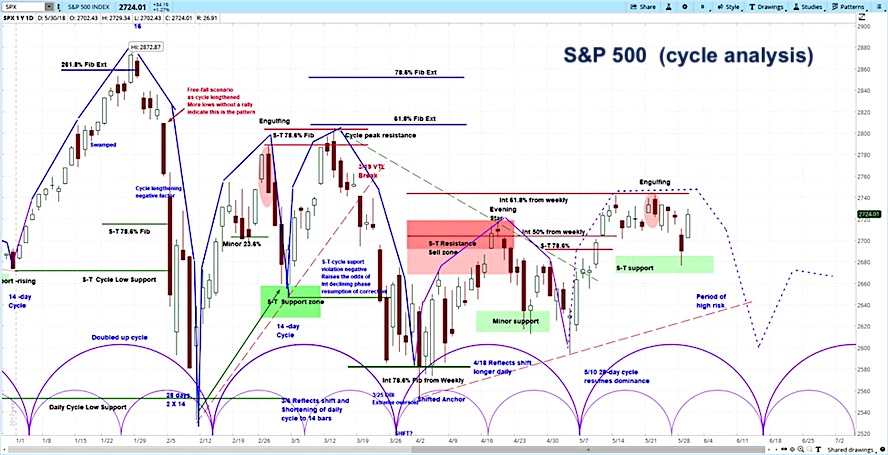
Stocks hold on but risk looms…
The week ahead could provide a bearish turn lower as the cycle accelerates. See my forecast below (and in-depth video) for more details.
S&P 500 Cycle Outlook for the Week of June 4:
- The stock market chopped around last week, with the S&P 500 (SPX) up 13 points to 2734, an increase of 0.5%.
- The market held up well considering growing risks such as escalating trade tensions and resurfacing risks to the European Union.
- Our projection for the near-term is for the S&P 500 to fall by over 100 points, a decline of 3-4%.
S&P 500 (SPX) Daily Chart from our Stock Index Report
On Monday, the US markets were closed due to the Memorial Day holiday. However, S&P 500 futures jumped after, over the weekend, Italian President Sergio Mattarella rejected the euro skeptic finance minister proposed by a new populist coalition led by Five Star and the League.
On Tuesday, the SPX was down 31 points, or 1.1%, measuring from Friday’s close. The markets focused on the uncertainty surrounding Italian politics and the effect that possible fall elections could have on the stability of the European Union. Yields on the 10-year US bonds fell to nearly 2.75% while Italian bonds rose to 3.4%. Meanwhile, US consumer confidence for May rose from 125.6 to 128, compared to expectation of 128.2.
On Wednesday, markets rebounded 34 points, or 1.3%, perhaps after deciding the concerns about Italy were premature. As well, US bond yields rose again while Italian bonds retreated. Meanwhile, German unemployment decreased by -11,000, compared to expectations of -10,000. In the US, ADP nonfarm employment for May increased from 163,000 to 178,000, compared to expectations of 186,000. And Q1 GDP increased by 2.2% on a quarter over quarter basis, compared to estimates of 2.3%.
On Thursday, the S&P 500 fell 19 points, or 0.7%, as President Trump imposed steel and aluminum tariffs and allied leaders threatened to retaliate. Also, pending home sales for April decreased from 0.6% to -1.3%, as Chinese manufacturing PMI and European consumer inflation increased.
On Friday, the S&P 500 rose by 29 points, or 1.1%, as nonfarm payrolls increased from 159,000 to 231,000, compared to estimates of 189,000. Also, German and US manufacturing PMI exceeded estimates at 56.9 versus 56.8 and 58.7 versus 58.2. This happened even as US allies gave impassioned speeches, staking out retaliatory measures on tariffs. Crude oil ended the week on a low note, decreasing by nearly 2% to below $66.
With equities up last week, gold was down -0.63%, and oil was down -3.18%, the euro was up 0.07%, and 10-year notes were down -0.09%.
Our Projection from our Stock Index Report
According to the askSlim Stock Index Report for this week, our analysis of the S&P 500 is for stocks to fall by over 100 points. Our target is between 2606-2642. During this period, the declining phases of minor and intermediate cycles on the daily chart will complete at the same time. This nesting of cycle troughs brings the greatest risks to the downside.
Beyond this, a larger market cycle is also set to complete during this summer. This is explained in our Big Picture Analysis, which looks at the declining phase of the current cycle.
For regular updates on our short term view, check out the askSlim Market Week show every Friday. Here’s our latest askSlim Market Week:
Twitter: @askslim
Any opinions expressed herein are solely those of the author, and do not in any way represent the views or opinions of any other person or entity.


