In this week’s investing research outlook, we analyze the technical setup and trends of the S&P 500 Index (INDEXSP:.INX), key stock market trends and indicators, and discuss emerging themes and news that we are watching closely in our investing research.
Here’s a summary of our findings for the week ending July 14, 2017:
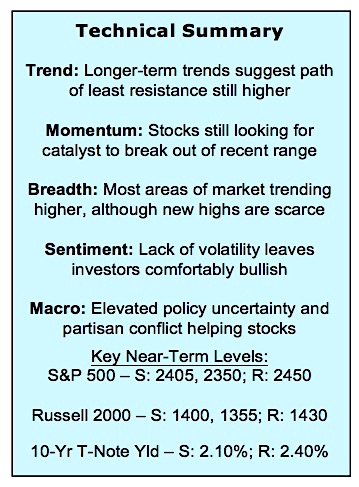
Patterns Broken; Patterns Persisting – While the nearly month-long pattern of lower highs on the S&P 500 was broken this week, the trading range between 2405 and 2455 was only marginally expanded. This week’s move sets up a breakout test of the all-time highs reached in June. Will we see follow through next week?
Optimism Easing, but Stocks Not Building Upside Momentum – Optimism remains elevated by most measures, but sentiment has been shy of exuberant, and bullishness has faded somewhat in recent weeks. While that could help clear the way for a more sustained move higher, we are not yet seeing evidence that the upside momentum that could fuel such a move is building.
Bond Yields Bounce – We have, however, seen bond yields move higher and momentum there is expanding to the upside. While 2.40% has emerged as a near-term resistance level, a re-test of the early year highs near 2.60% could be seen in the second half. Such a move could be bullish for Financials overall, and the Broker/Dealer index specifically, which is on the cusp of breaking out relative the S&P 500.
Stock Market Indicators
S&P 500 Index
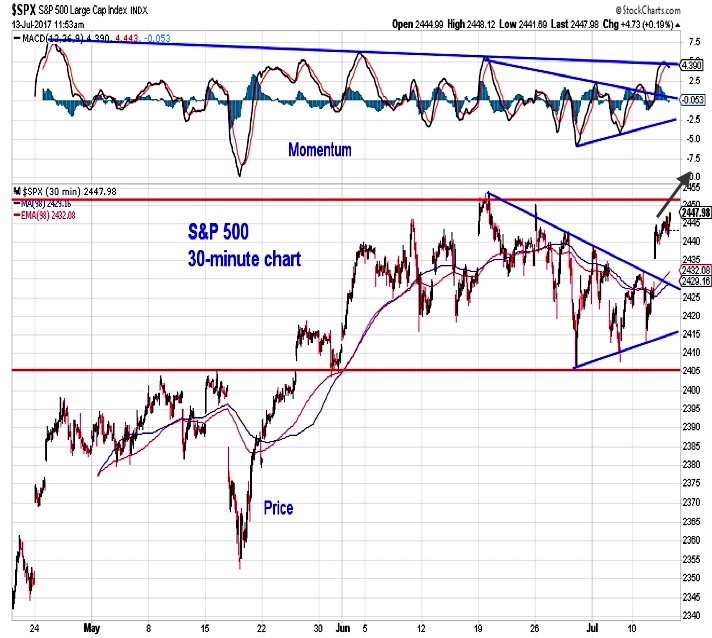
Coming into this week, the S&P 500 had traced out a pattern of lower highs on a short-term chart that stretched back to the mid-June peak. After putting in a sequence of higher lows, the S&P 500 was able to break above the emerging down-trend. While momentum has improved somewhat, it has yet to suggest a sustained summer rally is emerging.
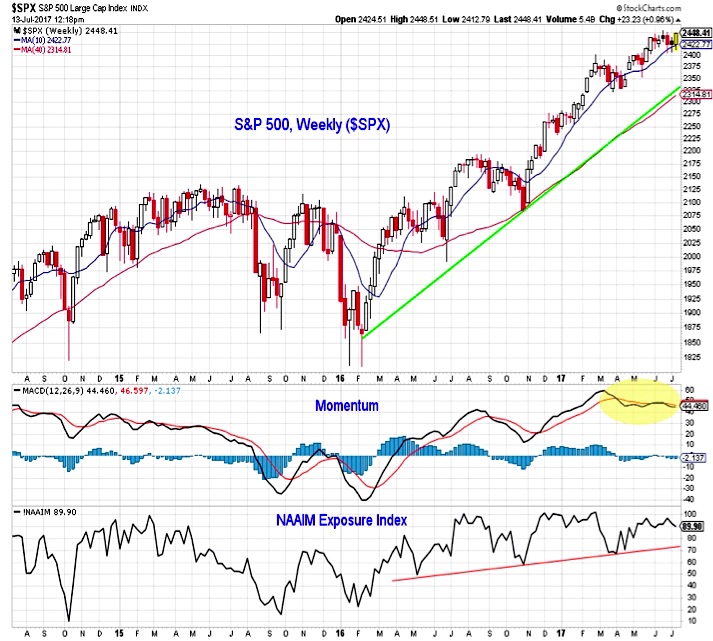
The weekly chart captures this lack of momentum more vividly. While the price trend continues to be higher, momentum stalled in the second quarter and has yet to get back in gear. This weekly chart also shows the NAAIM Exposure Index, which has edged lower over the past two weeks and has remained shy of its first quarter peak above 100. Overall, this suggests that while the price trend is higher, more consolidation may be needed before the next meaningful leg higher emerges.
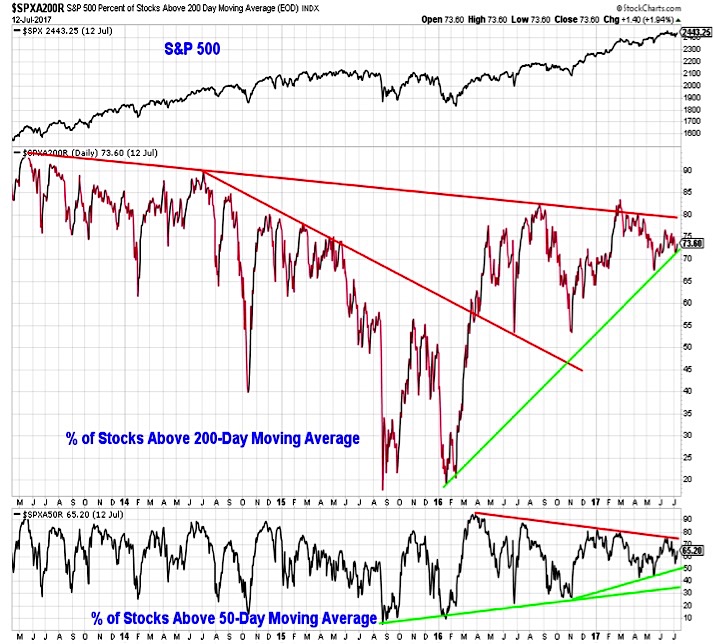
S&P 500 Market Breadth
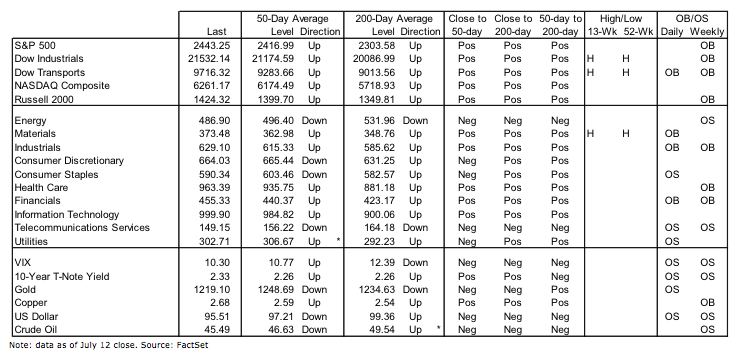
Stock market breadth remains in fine shape, but hereto, we are not seeing evidence of a meaningful breakout. Both the percentage of stocks above their 50-day averages and the percentage above their 200-day averages are between converging trend lines. A modest positive is that the rising trend in the percentage above their 50-day averages appears to be accelerating.
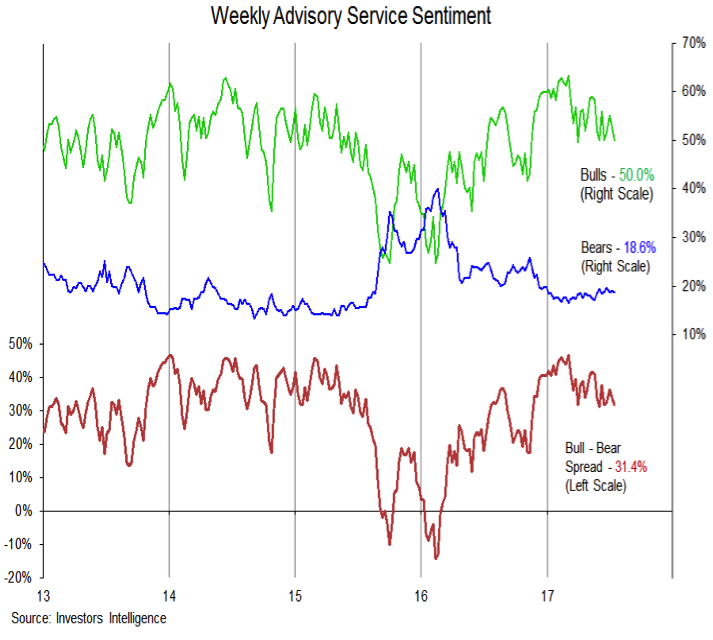
Investor Sentiment
The advisory service sentiment survey also shows an easing in optimism in recent weeks. Bulls on this survey have pulled back to 50%, the second lowest reading of 2017. Bears however, have not meaningfully risen. This leaves the bull-bear spread below its peak, but still at an elevated level. The AAII survey of individual investors this week shows bears exceeding bulls for the second week in a row, which is hardly evidence of exuberance.
continue reading on the next page…

: Showing Some Signs of Emerging Strength")

