The S&P 500 (NYSEARCA:SPY) continued its push higher, rising +2.4%.
But the roller coaster ride may not be over just yet…
The week ahead should see stocks begin to roll over a bit. See my forecast below (and in-depth video) for more details.
S&P 500 Cycle Outlook for the Week of May 14:
- The stock market rose last week, with the S&P 500 up 65 points to 2728, or 2.4%.
- The big headline was President Trump pulling out of the Iran deal led by crude oil and energy stocks.
- Our projection this week is for stocks to begin to roll over, after having started the rising phase of a new market cycle.
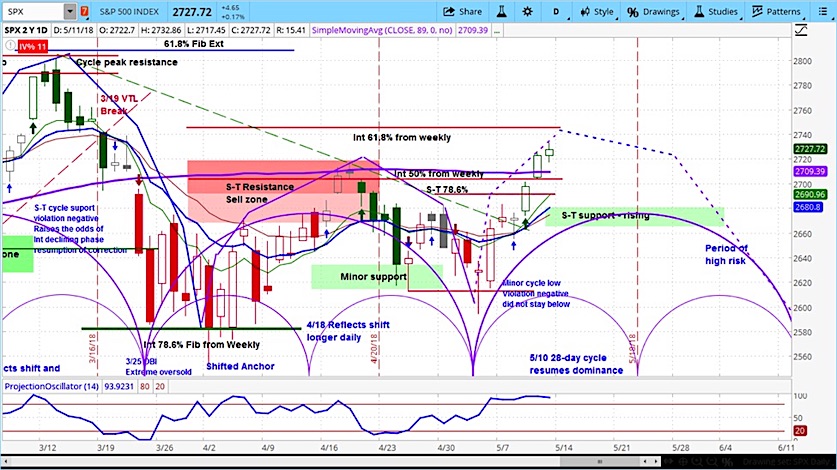
S&P 500 (SPX) Daily Chart from our Stock Index Report
On Monday, the S&P 500 rose 0.4% to 2673. Crude oil rose above $70 per barrel, on tensions related to Iran and Venezuela. Biotech led the way higher, with the SPDR Biotech ETF (XBI) rising by 1.3%. Consumer names lost ground, with the Consumer Staples Sector ETF (XLP) declining by 0.6%.
On Tuesday, the S&P 500 was basically flat, down 2 points to 2771. The Labor Department announced the results of the Job Openings and Labor Turnover Survey (JOLTS) for March, which came in at 6.55 million, above estimates of 6.02 and the February figure of 6.08 million.
The market was quiet for most of the day, awaiting the decision by President Trump on whether the US would remain in 2015 agreement with Iran, known as the Joint Comprehensive Plan of Action. Stocks wobbled after Trump’s decision to pull out, then pushed higher from the lows.
On Wednesday, the market was up nearly 1% to 2697, led by crude oil up 3%, along with energy stocks, via the Energy Select Sector SPDR ETF (XLE) nearly 2% higher. The Producer Price Index (PPI) came in at 0.1% for April, below expectations of 0.2% and the March figures of 0.3%. Crude oil inventories registered at -2.2 million barrels, below estimates of -0.2 million and the previous week’s figure of 6.2 million.
On Thursday, stocks were up another 0.9% to 2722. The Core Consumer Price Index (CPI) for April came in at 0.1%, lower than estimates of 0.2%, and the March figure of 0.2%. The 10 year US Treasury Note (/ZN) rallied for the day.
On Friday, stocks were up 6 points to 2728. The Michigan Consumer Sentiment figure for May was 98.8, above estimates of 98.5 and on par with the April figure of 98.8. Also, St. Louis Federal Reserve Bank President James Bullard implied that no further interest rates hikes were necessary. He argued rates had reached a level of “neutrality” in which they were no longer stimulating the economy.
With equities up last week, gold was up 0.42%, and oil was up 1.15%, the euro was down 0.16%, and bonds were down 0.26%.
Our Projection for the S&P 500 (SPX) This Week
Our approach to technical analysis uses market cycles to project price action. According to the askSlim Stock Index Report for this week, our analysis of the S&P 500 is for stocks to begin to roll over, within the context of its current minor cycle, shown on the chart above. The purple semicircles on the chart above represent the market cycles. Our recent Big Picture Analysis uses market cycles to project price action for the stock market in the intermediate term.
Twitter: @askslim
Any opinions expressed herein are solely those of the author, and do not in any way represent the views or opinions of any other person or entity.


