The S&P 500 (NYSEARCA:SPY) was down nearly 3 percent mid-week before rallying back to close down just -0.3%.
So the roller coaster continues for investors…
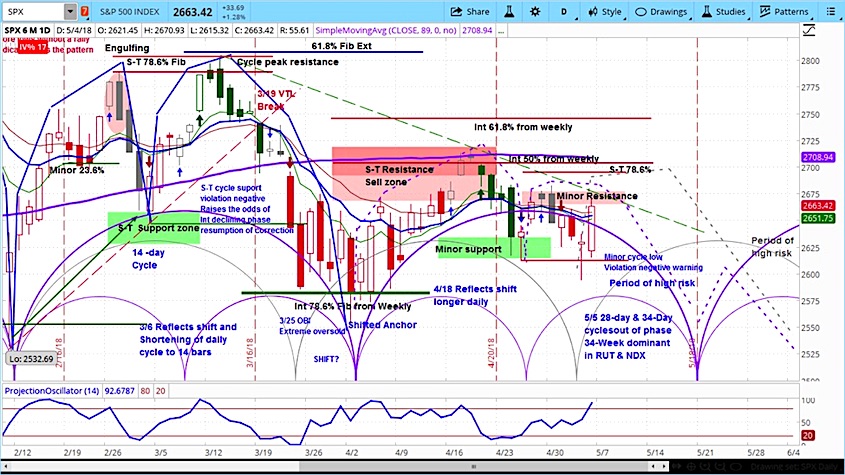
The week ahead should see stocks rise to around 2700 or so before rolling over. See my forecast below (and in-depth video) for more details.
S&P 500 Cycle Outlook for the Week of May 7:
- The stock market fell last week, with the S&P 500 (SPX) down 7 points to 2663, a decline of 0.3%, with major indexes mixed.
- Stocks got a boost on Friday by lower than expected wage inflation data and a signal from Warren Buffett he is still willing to buy at these levels.
- Our projection this week is for stocks to rise to 2700-2709 before ultimately rolling over.
S&P 500 (SPX) Chart with Daily Bars
On Monday, the Chinese Purchasing Managers’ Index (PMI) for April came in at 51.4, compared to estimates of 51.3 and the March result of 51.5. Also, US Pending Home Sales rose 0.4% in March, below to estimates of 0.6% and a February result of 2.8%.
On Tuesday, the US Institute For Supply Management (ISM) PMI for April came in at 57.3, below estimates of 58.6 and below the March result of 59.3. The report also showed an increase in the input costs, which has now risen for five consecutive months and is the highest reading since 2011. After the close, Apple (AAPL) reported earnings per share of $2.73 and revenue of $61.1 billion, which was higher than average estimates of $2.69 and $61.3 billion.
On Wednesday, the ADP Nonfarm Employment for April came in at 204,000, above estimates of 200,000 and below the March result of 228,000. The Fed left interest rates unchanged, noting that inflation was near its target and the labor market continued to strengthen. After the close, Tesla (TSLA) reported earnings of ($3.35) per share and revenue of $3.4 billion, beating estimates of ($3.53) and $3.27 billion. However, the TSLA tanked after CEO Elon Musk dismissed analysts’ questions regarding the company’s financial condition.
On Thursday, the ISM Non-Manufacturing PMI for April came in at 56.8, below estimates of 58.1 and below the March figure of 58.8. The report cited uncertainties over tariffs, tight labor market, and concerns over rising input costs.
On Friday, the US-China trade talks ended in a stalemate, with a White House statement noting it was a “frank conversation”. It will be interesting to see how President Trump responds to the lack of progress. Also, Nonfarm Payrolls for April came in at 164,000, below estimates of 189,000 and above the March figure of 135,000. The unemployment rate decreased to 3.9% and average hourly earnings came in at 0.1%, below estimates of 0.2%.
After falling for most of the week, the SPX rallied on Friday, perhaps due in part to concerns about wage inflation being alleviated by average hourly earnings figure. It may have also related to Warren Buffet’s announcement that he had purchased 75 million shares of Apple (AAPL). Investors may have taken it as a positive sign that a value investor such as Buffett would take such a position at these prices. However, we wonder whether he has just run out of investment ideas in this overcooked bull market.
With equities flat last week, gold was down 0.36%, and oil was up 2.47%, the euro was down 1.39%, and bonds were down 1.12%.
Our Projection for the S&P 500 This Week
Our approach to technical analysis uses market cycles to forecast price action. As described in the latest “Stock Index Report,” our projection for the SPX this week is for it to rise to 2700-2709 before ultimately rolling over.
This will be followed by a period of risk that will continue into the second half of May. As we explained in our Big Picture Analysis, we see the period from May to July as a period of high risk in the stock market because the declining phase of the current intermediate market cycle will conclude during that time.
For an introduction to cycle analysis, check out our Stock Market Cycles video. To obtain the latest version of the Stock Index Report noted above, become a free Level 1 member on www.askSlim.com.
Here is the latest episode of the askSlim Market Week:
Twitter: @askslim
Any opinions expressed herein are solely those of the author, and do not in any way represent the views or opinions of any other person or entity.


 Ready To Break Out?")


