 By Andrew Nyquist
Holiday weeks are typically lazy and full of directional drifts that tend to move upward. The key word here being “tend.”
This week started like your average holiday week with the S&P 500 drifting above the key 1363 level on Monday and Tuesday and higher yet into and out of the mid-week American celebration. But the lazy, low volume “float” finally caught up with the index causing it to slip intraday Thursday and gap lower on today. Jobs anyone?
This move lower begs the question, does the combination of low volume and holiday make this drop much ado about nothing? For answers, let’s turn to the technical charts.
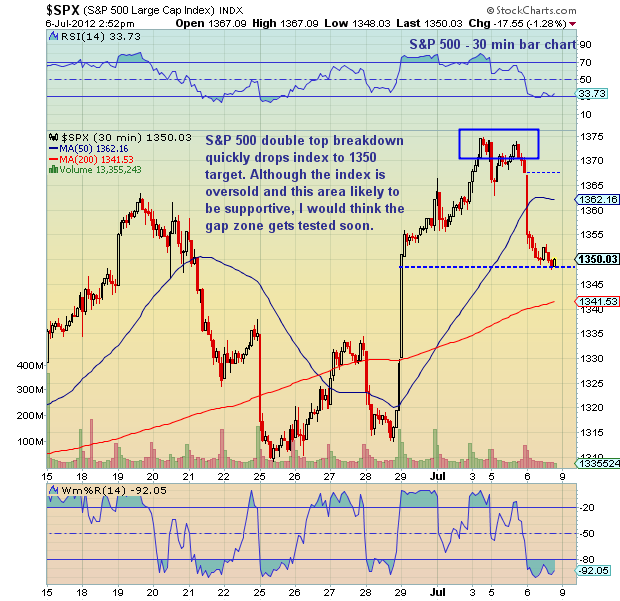
On the near term daily chart using 30 minute bars, you can see that the index formed a two day double top on Tuesday and Thursday and brokedown and out of the formation with the gap lower today. This breakdown measures to 1350ish, which is right on top of the large gap created by the European Summit bailout news. I would venture to guess that this gap gets tested sometime soon.
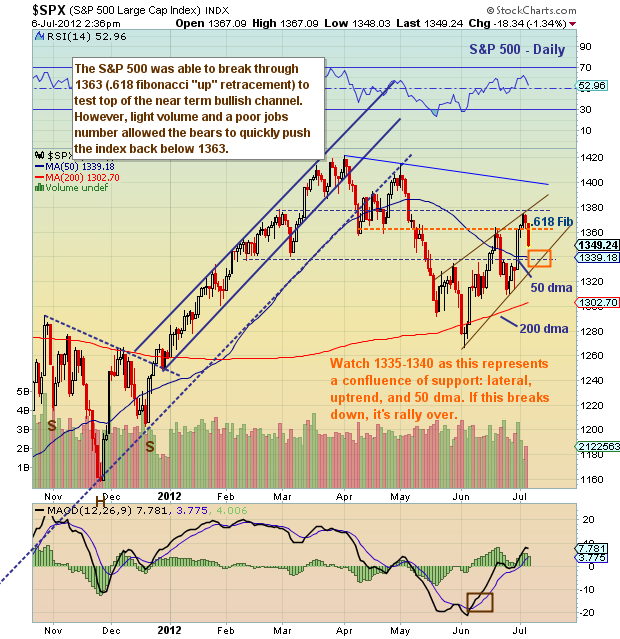
On the daily bar chart, a confluence of support can be found around 1335-1340. This confluence includes lateral and uptrend support, as well as the 50 day moving average (dma). A sustained break down through 1335 would likely spell further trouble for the index.
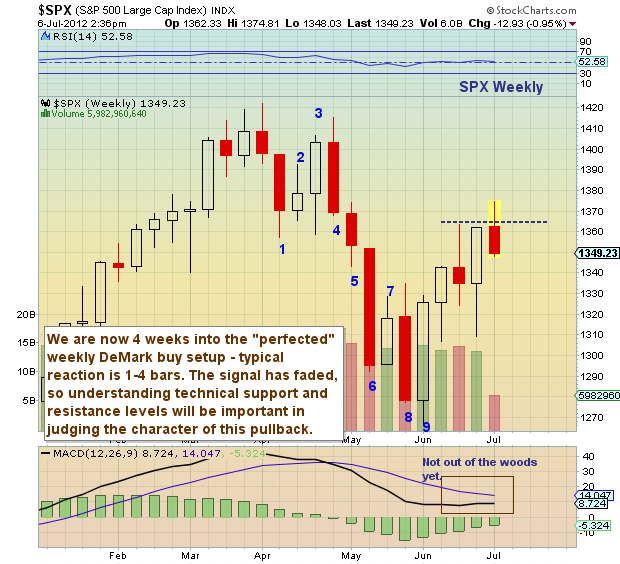
To further highlight the importance of holding the uptrend line, look no further than the fading DeMark buy setup in the weekly bar chart. The buy setup recorded 4 weeks ago, so the 1 to 4 bar reaction period will end with today’s closing bell. Now this doesn’t mean that the move higher is over, just that investors need to be more mindful of technical levels and risk allocations over the coming weeks. Could be choppy. Trade safe and have a great weekend.
30 minute Bar Chart:
Daily Bar Chart:
Weekly Bar Chart:
———————————————————
Twitter: @andrewnyquist and @seeitmarket Facebook: See It Market
No position in any of the securities mentioned at the time of publication.
Any opinions expressed herein are solely those of the author, and do not in any way represent the views or opinions of his employer or any other person or entity.


