 By Andrew Nyquist
Well it’s Friday and Wall Street is busy finishing up yet another wild week of “As Europe Turns.” And you know what that means: lots of whipsaws and sentiment extremes.
Without a doubt, this type of action makes a week feel more like a month! So if your feeling a bit dizzy, no worries, we all are.
With this in mind, I’ll keep the recap short… Monday was a dump session, as the reversal from last week spilled over into this week. Tuesday and Wednesday saw the market bounce — arguments ranged from “dead cat bounce” to European Summit hopes… but I’m thinking we were just plain oversold on a very short term basis. Either way, Thursday brought out the worry warts as rumors swirled overnight about the European summit. But, lo and behold, Thursday ended up putting on its best Turnaround Tuesday impression and saw the markets roar back into the close, setting the stage for today’s monster rally on news that Europe will effectively keep kicking the can.
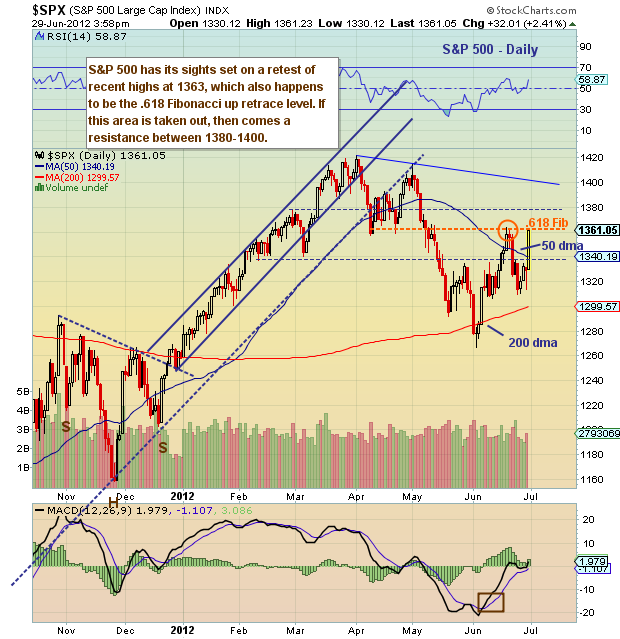
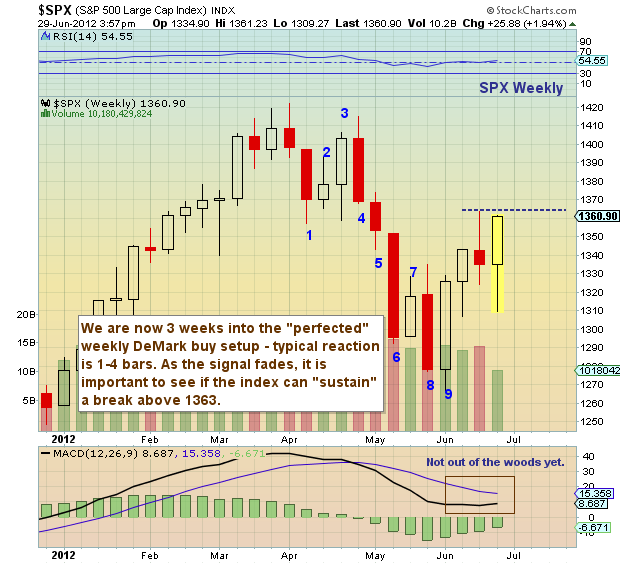
So where does this leave us technically? Well on the daily chart, the S&P 500 is eyeing up 1363 as overhead resistance. This marks the recent highs as well as the .618 Fibonacci retrace up level. A “sustained” break through this barrier could ultimately lead to 1380-1400. I use the word “sustained” because the weekly chart shows that we are already three weeks in to a DeMark weekly buy setup that typically sees a reaction period of 1 to 4 bars (or weeks). So if next week is the fourth bar of the reaction period, it’s do or die. A move above 1363 must be held, consolidated and pushed higher for 1400 to be a viable option.
For now, enjoy the “up” day and keep an eye on your support and resistance levels. When trading or investing, remember to buy into support and sell into resistance. Buy breakouts and sell breakdowns. I know, easier said than done. Wax on, wax off. Rinse and repeat. Ciao.
S&P 500 Daily Chart:
S&P 500 Weekly Chart:
———————————————————
Twitter: @andrewnyquist and @seeitmarket Facebook: See It Market
No position in any of the securities mentioned at the time of publication.
Any opinions expressed herein are solely those of the author, and do not in any way represent the views or opinions of his employer or any other person or entity.


