Stock Market: A Lot of Noise
Reading the newspaper headlines, watching the business (now political) channels, and reading social media posts, one would think the economy would be in a recession, stocks would be in a bear market, and the U.S. would be headed for World War 3.
Long-time readers know I do not comment on politics and I do not comment on the economy or market fundamentals. Just the Charts!
So what can be gleaned by the current incredibly “noisy” environment as far as the market is concerned? Over the long-term, the market really doesn’t care what goes on in Washington, D.C. Yes, this policy may affect this sector and yes certain policies are more bullish than others, but the economy and the stock market do their own thing. Predicting what the market will do based on what is going on in D.C. is just, well, fruitless. The same goes for predicting what the stock market will do based on economic forecasting or earnings estimates for the S&P 500 (INDEXSP:.INX). For instance, I believe earnings for the “500” have been falling in recent years, yet the market has gone higher. Economic growth has been anemic for years, yet the bull keeps charging. Let the genius at the cocktail party tell you how to analyze the market based on any of this and then show him a chart. If his ego doesn’t get in the way, he’ll get it.
The reaction to news (this may take a couple of days) is much more important than the news itself. This is especially true at major turning points in the stock market. When individual stocks and the market overall stops rallying after better than expected earnings reports or better than expected economic data, take note. When stocks and the market stop falling after poor numbers, also take note. The market has already discounted the good or bad numbers and is turning the other way.
Just this past week, there were some very good earnings reports from a number of major technology companies. Microsoft (NASDAQ:MSFT) gapped up after reporting results, only to turn tail and drop right back to its recent base. Facebook (NASDAQ:FB) was all the rage after reporting yesterday and was up big after hours only to give it all back today. Apple (NASDAQ:AAPL) did see a very nice breakout and so far, it’s holding those gains. My guess is that MSFT and FB had already discounted those better than expected numbers, so even the EPS and revenue beats were already in the stock. There was probably more skepticism about AAPL coming into its numbers. This is another reason why a pullback may be coming. The market ran up into EPS season, so it was already discounting good news. There is an old saying on Wall Street, “Buy the rumor, Sell the news.”
The stock market remains confined to an extremely narrow range even after the minor breakout to new highs last week. Over the past couple of days, the breakout seemed in danger of failing on the S&P 500, but so far, it’s holding on.
A failed breakout of the 2,275 area may indicate that the long awaited pullback is finally upon us. Failed breakouts as well as failed breakdowns are pretty reliable patterns and then tend to at least go back to the other end of their recent range. That is, a failed breakout now would at least go back to the recent bottom of the range from late December down at 2,234.
So why haven’t the major indices pulled back yet? In a word, rotation. I have mentioned this before, but the lifeblood of any healthy bull market is market rotation. There has certainly been a lot of that lately. Late last year, financials, industrials, and steel stocks were some of the hottest areas of the market.
These areas have cooled, especially the steel stocks in early 2017. Technology picked up the slack early this year, with biotechnology and healthcare showing signs of life this week. The point is that money is staying in stocks, and just moving from sector to sector. Until that changes, and money starts to come out of the market, prices seem destined to be pinned at these high altitudes.
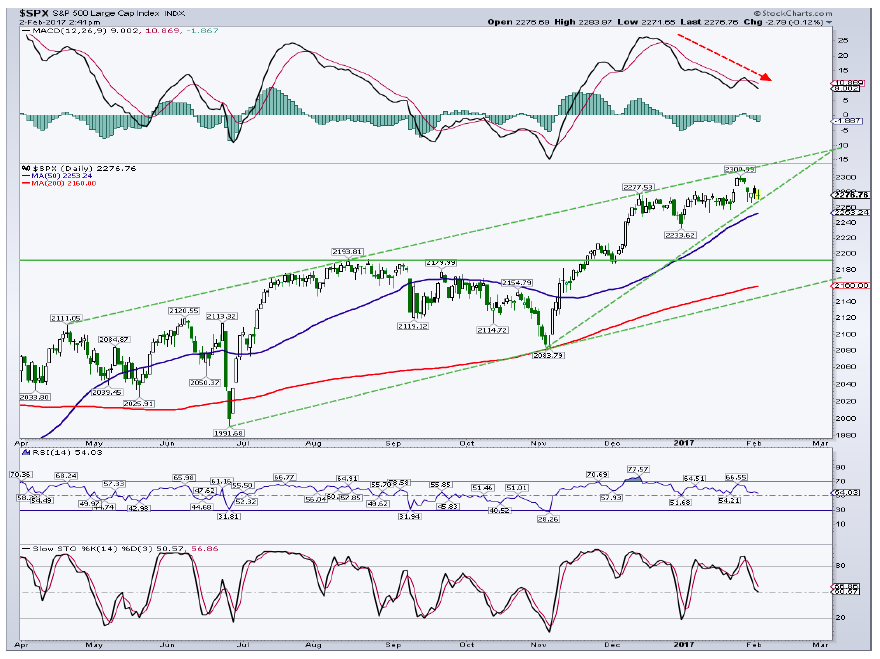
I have very little to add from comments on the S&P 500 from a couple of weeks ago. We had a minor breakout that looks to be failing, or it certainly is having a tough time getting any follow through. If we do get a downside shakeout, the first piece of minor support comes from the rising 50-day average, and many times support during an uptrend, at 2,254. The first piece of minor chart support sits at the recent low of 2,234. The majority of decent support lies down at/near the breakout area of 2,200. For now, I’m still looking for a test of the 2,200 to 2,220 region before the next leg higher resumes.
The “500,” and many other indices have been fairly stretched from their respective 200-day moving averages. This generally leads to a pause in the rally, which we have seen, and many times an outright retracement in prices.
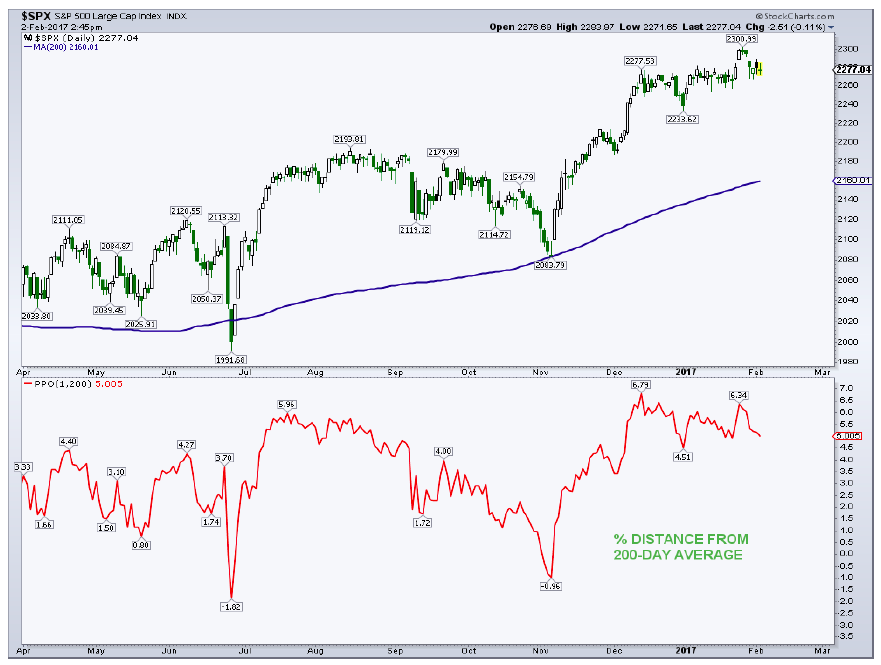
The S&P 500 is about 5% above its 200-day average, down a bit from the 6%+ seen in December and January. This is the largest distance that the “500” has been above its 200-day since back in November/December 2014. In recent years, and taking out the late 2015/early 2016 corrections, the gap between price and average generally oscillates between about -1% and 9%.
As I have written many times of late, market sentiment appears overheated and in desperate need of a reset. The majority of sentiment indicators we monitor are quite stretched and in most cases, this equates to a major hurdle for the stock market. One area of market sentiment that we don’t talk about much is NYSE and NASDAQ Short Interest (SI). Short Interest, back in the day, was a popular tool for technicians and was probably talked about on TV as much as the VIX is today. Quite simply, SI is the number of shares of a stock sold short but not yet covered (bought back).
SI is reported every two weeks and the data is lagged. The latest NYSE SI is the lowest since December 2014, which was not a great time to be putting money into the market. NASDAQ SI is the lowest since February 2014, and right before a decent pullback in the index. When SI is high, it is fuel for the stock market as these shorts are eventually covered. When SI is low, that piece of the bullish puzzle is removed. And when SI is low but rising, it can put pressure on the market.
Conclusion: Seasonals are no longer a tailwind for stocks and with bullish sentiment roaring, I suspect a decent shakeout (3% to 5%) is coming. Looking out, I see the S&P 500 reaching the 2,500+ region sometime in 2017.
Thanks for reading. Reach out to me at arbetermark@gmail.com for inquiries about my newsletter “On The Mark”, if interested.
Twitter: @MarkArbeter
Any opinions expressed herein are solely those of the author, and do not in any way represent the views or opinions of any other person or entity.

: Showing Some Signs of Emerging Strength")
