Over the past several months, the S&P 500 has managed to climb higher while momentum is slowing and volatility is re-emerging. As we’ve noted several times, this is a sign of a market in flux.
Call it choppy, call it indecisive, or call it uncertain, it really doesn’t matter. The bottom line is that price is the final arbiter. And thus far, the bulls have miraculously held there own.
But the storm of market swings and unrest will likely be here for a while longer. I highlighted this battle of bulls and bears (and levels to watch) in last week’s S&P 500 Market Update. There’s definitely an opportunity for bears to exploit the market’s weakness but that remains to be seen.
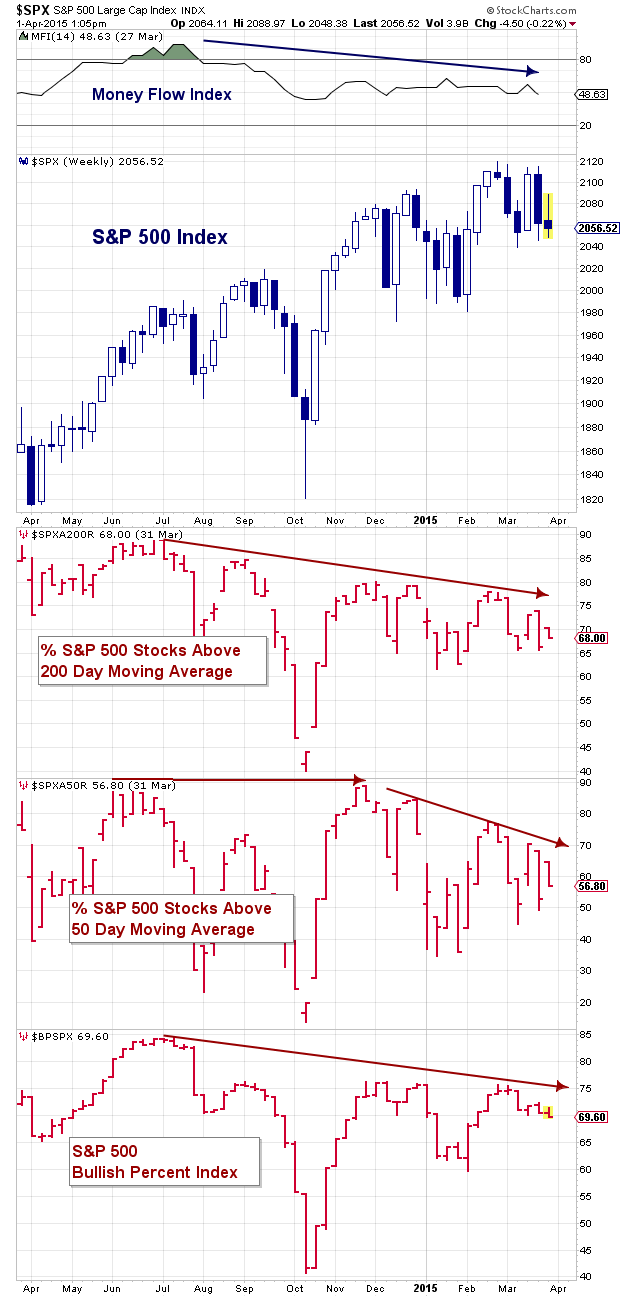
Looking at the charts below, you can see how the S&P 500 has managed to grind higher under deteriorating circumstances. The Money Flow Indicator (MFI) has been trending lower for some time (price x total volume). As well, market breadth has weakened over time, as the %stocks in the S&P 500 above there respective 50 day and 200 day moving averages has failed to reach new highs for months. And lastly, the S&P 500 Bullish Percent Index, which measures the % of stocks with a ‘Point and Figure’ buy signal, is also showing a pattern of weakening.
So what gives? Why hasn’t the market collapsed under this bevy of divergences and slowing momentum? The likely answer is demand. There has been enough capital flowing into U.S. assets. Low rates of return domestically (and even more so abroad) continue to force capital out of cash reserve accounts. Since the financial crisis, other countries have tried to play catch up with QE/stimulus and this has spawned extremely low to negative interest rates in Europe and elsewhere.
BUT, even under these circumstances, the market can correct or fall down on its own weight. Make no mistake, the S&P 500 is vulnerable to a correction here. But the clock is ticking… and the market could simply be correcting through time as opposed to price.
S&P 500 Index – market breadth and momentum tick lower
Follow Andy on Twitter: @andrewnyquist
No position in mentioned securities at the time of publication. Any opinions expressed herein are solely those of the author, and do not in any way represent the views or opinions of any other person or entity.


