Although the S&P 500 is just 1.5% off its all time highs, it’s fair to say that 2015 has been a chop-fest for active investors. And this doesn’t solely apply to the equity markets – it has been choppy for bonds, currencies, and commodities as well. Without regurgitating all the details, it’s also fair to say that investors have had A LOT of noise to deal with.
This is the primary reason that I like to focus on price. It doesn’t always clear the skies up and make everything rosy, and it isn’t always “right”. But it does help us paint a picture of the market within a given time frame so we can better define our risk and exposure levels.
As an active investor, I like to start with the macro picture and work down to the near-term. It gives me a sense of the long-term, intermediate term, and short-term trends.
In a broad sense, we know that the market has been in a macro uptrend for some time and that the S&P 500 is still well above levels that would put the uptrend into question. So we can say with confidence that the longer term trend is still up. And it’s probably okay to surmise that being 1.5 percent off all-time highs puts the intermediate term trend in similar company.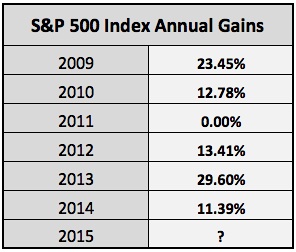
This doesn’t mean that the market is “safe” here, or that investors should put “new” money to work tomorrow. It just means that we haven’t seen any major technical support levels taken out. As well, from a fundamental standpoint breadth is on watch, but improved.
From here we’ll turn our focus and discussion to the near-term.
2015 has seen momentum slow, as the market tries to digest its past several months of price discovery. That has lead to a lot of chop. Chew on these two data points:
- It’s been 25 days since the S&P 500 had 2 up days in a row. That’s the longest streak since 2001.
- And we just ended 8 days in a row of up/down on the S&P 500.
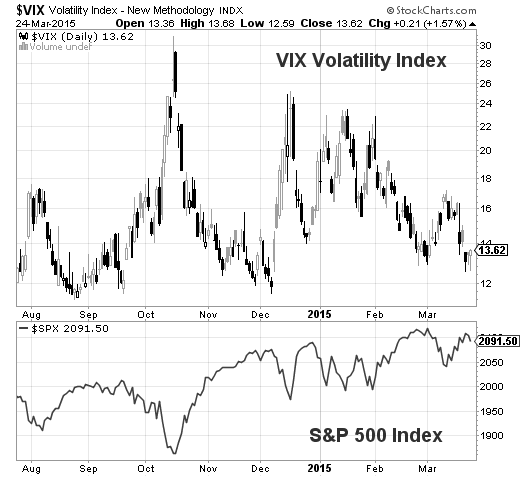
In the chart below, you can see that we’ve had some big swings within a sideways to higher channel. It’s also clear that some caution is still warranted as the Volatility Index (VIX) recently touched down near levels that saw the S&P 500 rollover in its recent past.
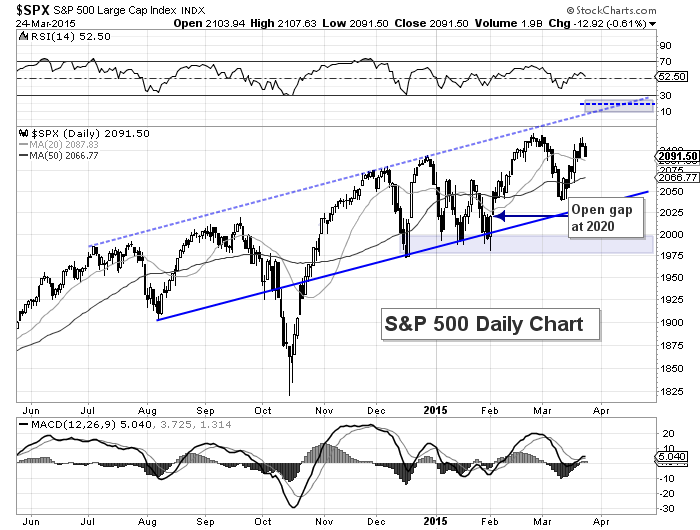
Right now, the S&P 500 is sitting under its 2015 highs (while the Russell 2000 and Nasdaq Composite have recently made new highs). So 2120 will be an important resistance level, with the top of the channel (around 2135-2140) providing secondary resistance. Note that the channel top is also near the 1.618 major Fibonacci extension level (using ’09 intraday lows and ’07 intraday highs). One level higher is 2160-2170.
Price is currently above the 50 day moving average and we have a higher low in place (the March lows). These two levels will serve as initial supports, with the latter being more important (caution if broken). We have two consecutive down days in a row, which may not sound like a big deal, but investors need to be on alert for any rolling over (similar to other short-term “turns”).
The next level lower would be the open gap at 2020, followed by a confluence of December/January/February lows between 1975-2000.
S&P 500 Daily Chart
The market will likely need to string together some positive days here to avoid a short-term rollover. Holding above the 50 day moving average would increase the likelihood of new highs for the S&P 500 and a potential test of its upper channel boundary. But as much as we are prone to make “calls” and feel compelled to trade, it’s probably best to let the market come to you and define your trades and investments by your time frames.
Follow Andy on Twitter: @andrewnyquist
No position in mentioned securities at the time of publication. Any opinions expressed herein are solely those of the author, and do not in any way represent the views or opinions of any other person or entity.


: Showing Some Signs of Emerging Strength")
