Key Stock Market Takeaways For Investors:
– Momentum trend providing stocks with a tailwind.
– S&P 500 Index (and other broad stock market gauges) show breadth to be bullish but trends not exhaustive.
– Geopolitical tensions take edge off of optimism.
Annual outlook pieces can be important when used as a compass (check out both our outlook and the supporting chart pack) but are a hindrance when they become an anchor. Investors can be guided by our outlook, but should not be unduly tethered to it.
Rather, we need to watch how situations in the markets and the economy actually develop over the course of the year.
Our latest update shows that the weight of the evidence remains tilted toward the bullish camp. Today we take a closer look at some of the market factors supporting that view.
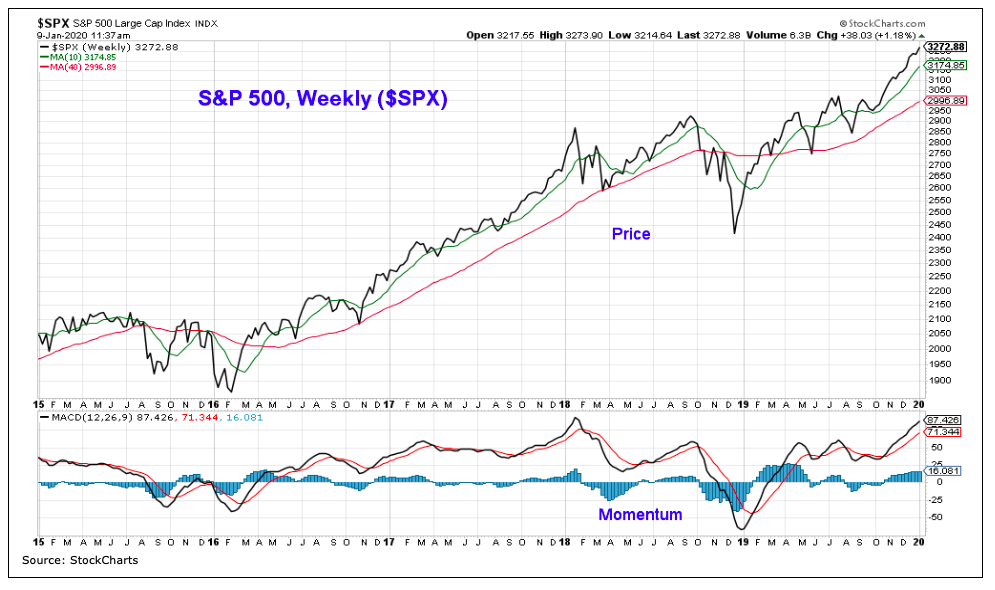
The S&P 500 Index now has the wind at its back with respect to price, breadth and momentum trends. While the index marginally surpassed its January 2018 peak in September of that year and again in the second quarter of 2019, those higher price highs came with unconvincing breadth and poor momentum. Those concerns largely ebbed in the fourth quarter. New price highs on the S&P 500 were accompanied by improving momentum and the rally attracted much broader support, both at home and overseas.
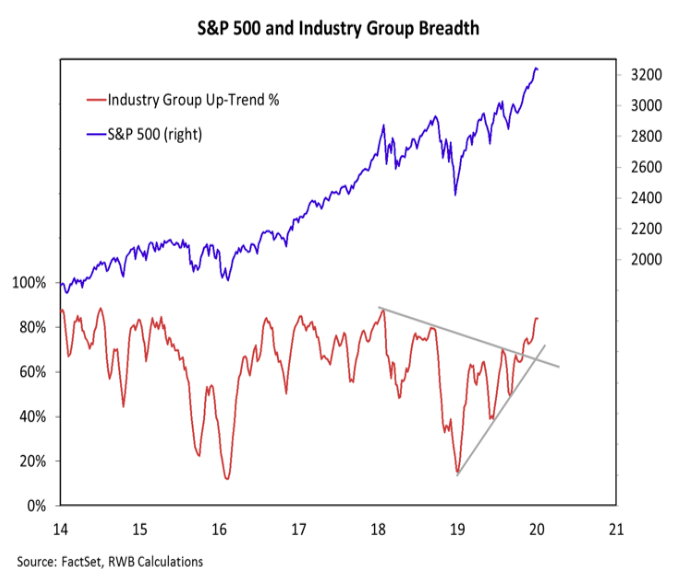
If we had to sum up what happened in 2019 from a breadth perspective with just one tid-bit it would be this: at the beginning of the 2019 just 15% of industry groups (across capitalization levels) were in up-trends and by the end of the year 84% of groups were trending higher.
The pattern of lower highs on this indicator that emerged in 2018 and carried into the first half of 2019. By the end of the year, however lower highs were replaced with higher lows and higher highs. Global markets also saw improvements and new highs were being made around the world. On a shorter-term basis, our sector-level trend indicator (updated weekly here) is off its highs but remains supportive.
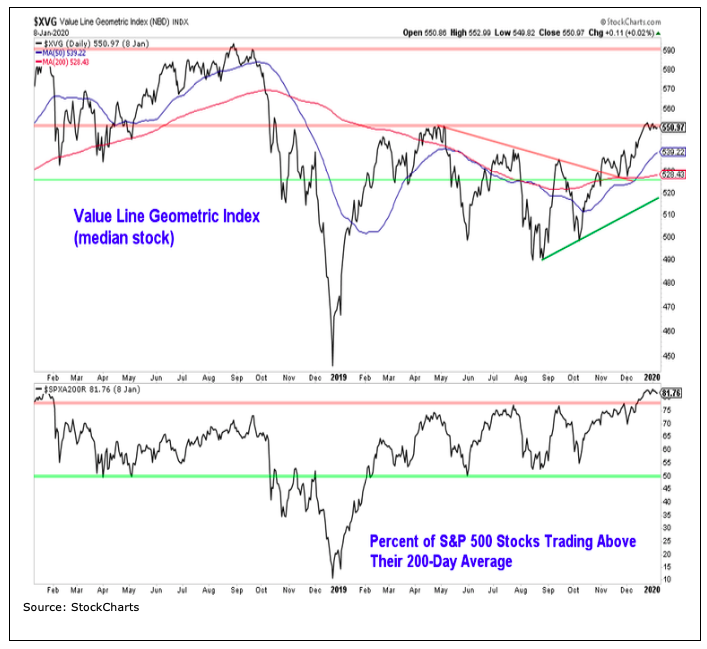
Breadth has turned bullish, but there is still room for improvement. The Value Line Geometric Index (which provides a sense of how the median stock is faring) has broken its pattern of lower, but is struggling to get through resistance at its early 2019 highs. The late-2018 peak remains off in the distance.
The S&P 500 (large-caps) is more than 10% above its September 2018 peak, while the S&P mid-cap index is currently at its September 2018 level and the S&P small-cap index is more than 5% below its level from September 2018.
The new high list is finally showing signs of life, but it remains relatively muted. Overall, breadth is improving and is providing the stock market with a bullish tailwind. It does not appear to have reached levels that appear exhaustive from a longer-term perspective.
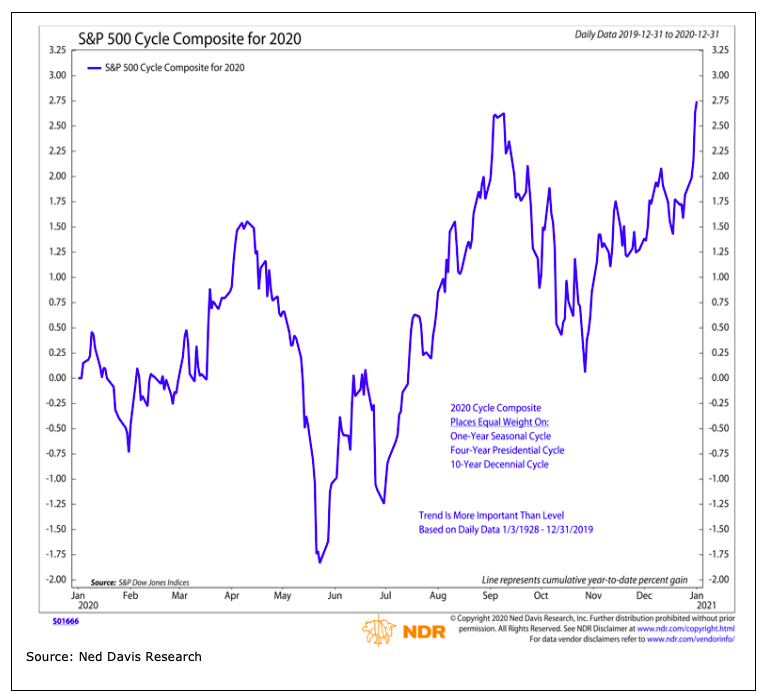
Presidential election years tend to have a positive bias, although the opportunity for gains is best in the wake of the election (or at least once the election outcome appears fairly certain). Renewed geopolitical uncertainties could add to the customary election-related noise and add to volatility heading toward mid-year. From a seasonal perspective, odds for sustained gains improve into the second half of the year.
One upshot to increased international tensions is they could take the edge off of investor sentiment, which had moved toward excessive levels in late 2019. Beyond the ebb and flow of optimism and pessimism as represented through the various daily and weekly sentiment indicators, a deep-seated complacency appears to have emerged after a decade of strength and leadership from U.S. stocks. If/when this becomes a meaningful issue for the market remains to be determined.
There is something else that has caught our eye – the widespread attention being paid to sentiment right now has lessened its usefulness as a contrary indicator. Over the past few years, stocks have fared the same whether optimism is excessive or pessimism extreme.
Twitter: @WillieDelwiche
Any opinions expressed herein are solely those of the author, and do not in any way represent the views or opinions of any other person or entity.


