Broad Stock Market Outlook for March 26, 2018
Intraday motion faded sharply on Friday and the dips presented value buyers overnight opportunities to pick bottoms. Formations like this suggest that there are trapped buyers around so the first pass into resistance (very close to these numbers currently) should fade.
Bottom picking will create cross currents of motion so itchy fingers will be prone to risky trades – watch your support as the currents are still very negative.
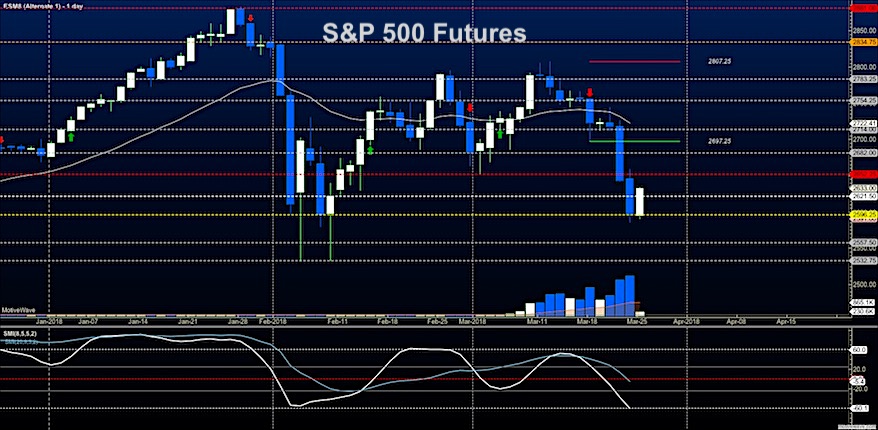
S&P 500 Futures
Sunday bounces have held into the morning as resistance looms nearby the levels between 2636 and 2648. I expect the lows of Sunday evening to hold today but the failure to stay above 2621 will break that resolve. Momentum is mixed but still bearish in the current cycle. The bullets below represent the likely shift of trading momentum at the positive or failed retests at the levels noted.
- Buying pressure intraday will likely strengthen with a bullish retest of 2641.5
- Selling pressure intraday will likely strengthen with a bearish retest of 2623.5
- Resistance sits near 2636.5 to 2652.75, with 2664.25 and 2684.75 above that.
- Support sits between 2621 and 2596.75, with 2585.75 and 2558.50.
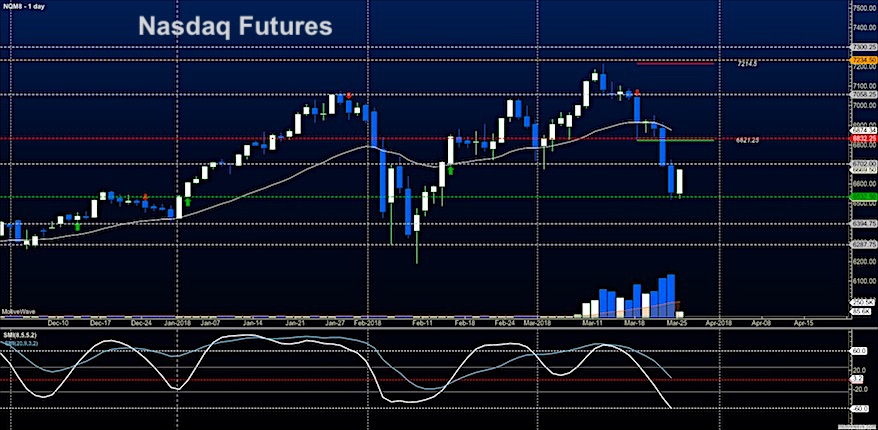
NASDAQ Futures
Bounces here off deep support have held in the early morning as the bearish momentum indicators begin to flatten. Buyers are trying to pick a bottom once again. This time, I expect the lows to hold but again, watching the support action across the board near 6590. The bullets below represent the likely shift of intraday trading momentum at the positive or failed tests at the levels noted.
- Buying pressure intraday will likely strengthen with a bullish retest of 6702.25
- Selling pressure intraday will likely strengthen with a bearish retest of 6610.50
- Resistance sits near 6672.5 to 6702.5 with 6801.5 and 6861.5 above that.
- Support sits between 6590.75 and 6548.75, with 6519.25 and 6494.75 below that.
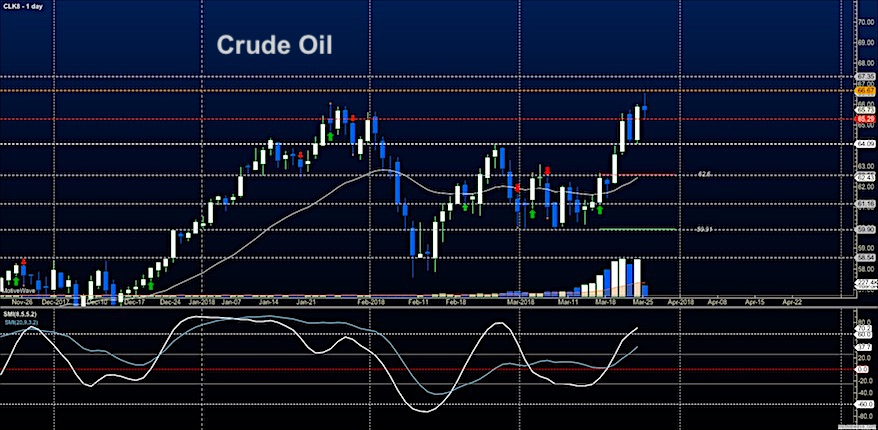
WTI Crude Oil
Expansions to higher resistance continue with a test of 66.5 Momentum remains bullish and the price is still extended but the formation holds and pullbacks will still be buying zones for eager bullish traders. Holding 65.19 will be key. The bullets below represent the likely shift of intraday trading momentum at the positive or failed tests at the levels noted.
- Buying pressure intraday will likely strengthen with a bullish retest of 66.05
- Selling pressure intraday will strengthen with a bearish retest of 65.17
- Resistance sits near 65.74 to 66.54, with 67.3 and 68.24 above that.
- Support holds near 65.30 to 65.17, with 64.51 and 63.76 below that.
Twitter: @AnneMarieTrades
The author trades stock market futures every day and may have a position in mentioned securities at the time of publication. Any opinions expressed herein are solely those of the author, and do not in any way represent the views or opinions of any other person or entity.

: Cup (and Maybe Handle) Watch")
 Reaches Important Price Support")

