I am a market timer. I love to time the ebbs and flows of the S&P 500 Index (INDEXSP:.INX) using Pivot Points.
Last June I wrote a post here right after the S&P 500 (SPX) failed at the Fibonacci YearlyR1 Pivot Point at 2120. At that time, I said the SPX would fall to 1997 soon. Here’s an excerpt:
“Since the S&P 500 Index failed to close above the Fibonacci YearlyR1 Pivot Point, I see potential risk of a bigger pullback down to the Fibonacci and Floor Traders Yearly(P) S&P 500 trading pivot point at 1997. When these happen I call them “Pivot Price Patterns”. This action brings lower price targets into view…”
Just two weeks later Brexit came and stocks fell swiftly. During that quick decline, my S&P 500 pivot point target at 1997 was hit.
The S&P 500 later rallied to the YearlyR2 pivot in August where price consolidated for a few weeks before falling back to the YearlyR1 pivot @ 2120 this week.
Can you see how computer algorithms like to move price from pivot to pivot? Knowing in advance where these Pivots are is key!
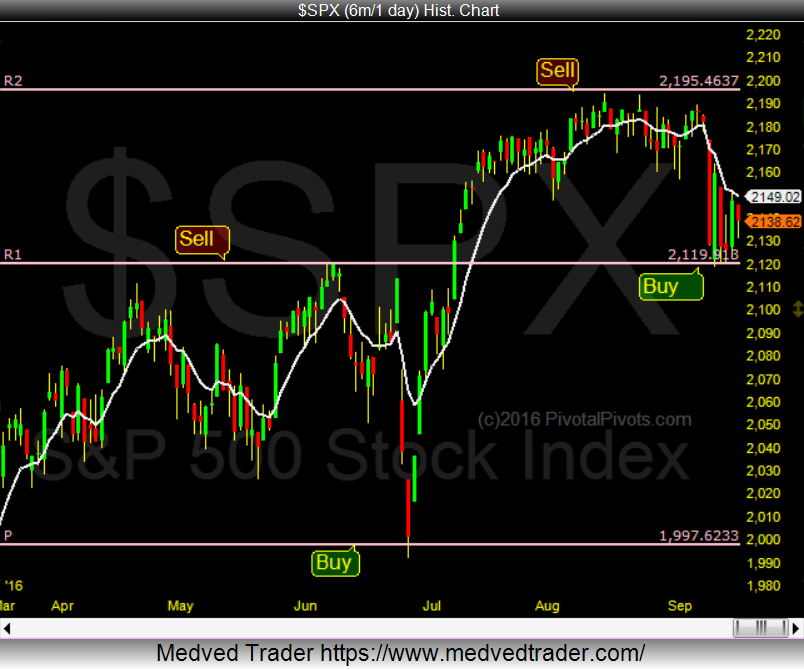
If the S&P 500 index closes below the YearlyR1 Pivot at 2120 will open the door for a possible retest of the Brexit low around 1997 in October. S&P 500 pivot points highlight key levels. Watch 2120… and keep some powder dry!
Thanks for reading.
Twitter: @Pivotal_Pivots
The author does not have a position in mentioned securities at the time of publication. Any opinions expressed herein are solely those of the author, and do not in any way represent the views or opinions of any other person or entity.

: Showing Some Signs of Emerging Strength")
