S&P 500 Index (INDEXSP: .INX) Trading Analysis Image
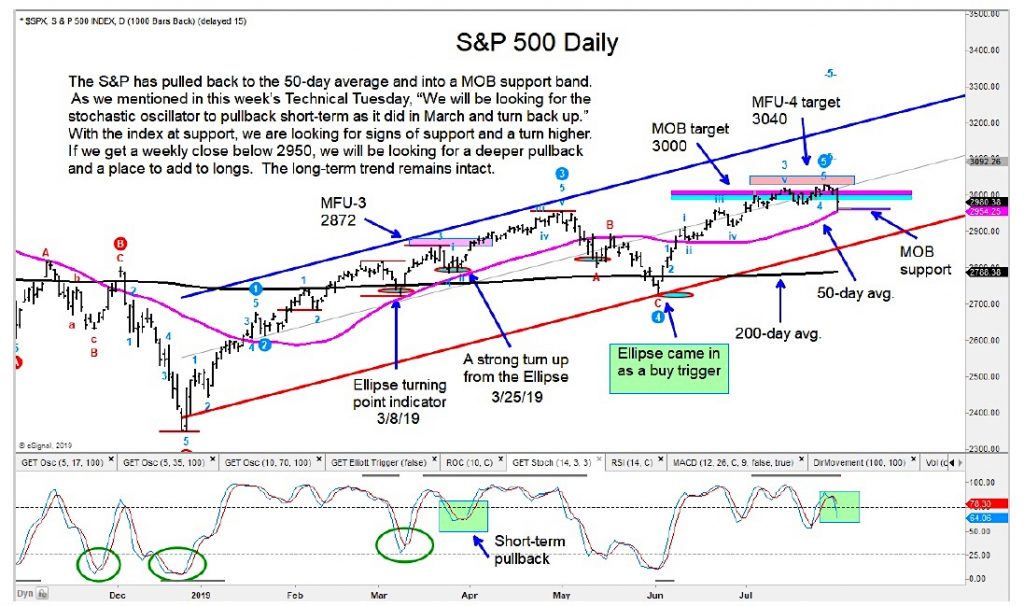
The S&P 500 Index has pulled back near the 50 day moving average and into my MOB support band.
I am watching the stochastic oscillator to see if we get a pullback near-term (and look for a turn back up to confirm bullish bias).
We continue to be bullish and will look for higher prices, perhaps hitting our 3040 price target on the S&P 500.
Only a weekly close below 2950 would have us looking for a deeper pullback.
We are long-term bullish equities and see fund flows coming in on any deeper pullback or even correction.
The author may have positions in mentioned securities at the time of publication. Any opinions expressed herein are solely those of the author, and do not in any way represent the views or opinions of any other person or entity.
: Creating Bullish Divergence?")


: Creating Bullish Divergence?")