S&P 500 Index Trading Outlook (3-5 Days)- Mildly Bearish
Looks like at least a minor pullback has gotten underway a few days early. While a few warnings signs were in place it was necessary to wait for the price break, which we got, and held by end of day.
But this is simply a short-term observation that hasn’t been given reason (just yet) to believe that a bigger pullback is underway.
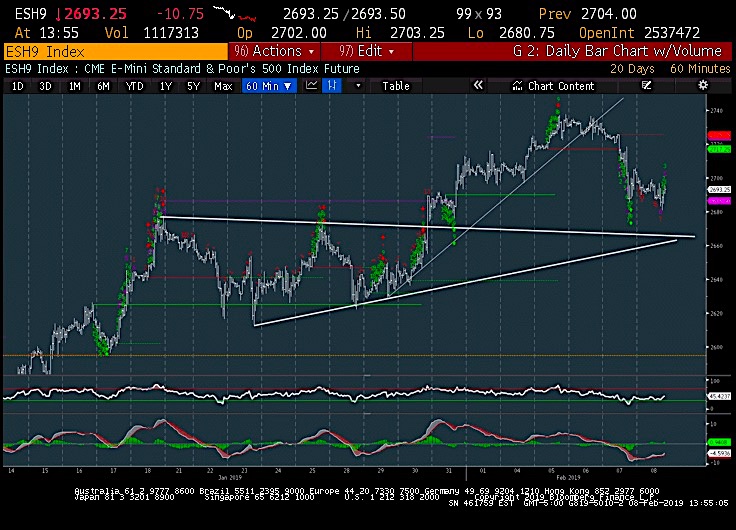
S&P 500 “hourly” Chart Analysis
The hourly chart of the S&P 500 shows prices having gotten down to 2685 today (which was yesterday’s low).
We have held that level thus far today and the market is trying to move higher here. The 2685 price area (or today’s intraday lows 2682) is very important to hold near-term. Under leads to 2663-5, while getting back up above 2706 would be important and likely push the S&P 500 back up to 2722-6.
Around the market…
Energy still leading on the downside this week, and January’s outperformance looks to be completely unraveling in the last week, with this sector down sharply. (January’s best performing sector is now this week’s worst)
Elsewhere, Financials have also been hard hit after good performance in January but nearing support into next week which I think could be a positive for markets if this group tries to hold and turn back higher. For now, a very selective market, but the technical selling hasn’t proven too extreme thus far, and Technology is still the 2nd best performing group this week, which is telling
Summary
Well, all the pieces were in place to suggest an upcoming reversal, except for the price action itself. We seem to have gotten that yesterday with the pullback down to multi-day lows. Breadth, which had been flat for the last few days, expanded to 3/1 negative on the decline, and at one point there were 8 sectors out of 11 down on the day.
The reasons cited mentioned cycles based on 90 day and 360 days, along with breadth deterioration in the near-term. Additionally, Demark exhaustion was close to being completed while Financials had not been working well as Treasury yields have been trending lower with both stocks and bonds rallying in unison. All these are far more importnat technically than the oft-cited reasons about China trade, which has been an ongoing concern and just now being discussed as a reason for “why” equities pulled back.
Overall, it’s tough making the call for a pullback down to prior lows in any sort of retest, as stocks have been up nearly 15% in 5 weeks and will need far more than 1 day of selling to argue that the trend is vulnerable to a retest. For now, a pullback to 2662-5 is possible and violating yesterday’s lows is the first step to this, (2685) so this area is key.
If you have an interest in seeing timely intra-day market updates on my private twitter feed, please follow @NewtonAdvisors. Also, feel free to send me an email at info@newtonadvisor.com regarding how my Technical work can add alpha to your portfolio management process.
Twitter: @MarkNewtonCMT
Author has positions in mentioned securities at the time of publication. Any opinions expressed herein are solely those of the author, and do not in any way represent the views or opinions of any other person or entity.


