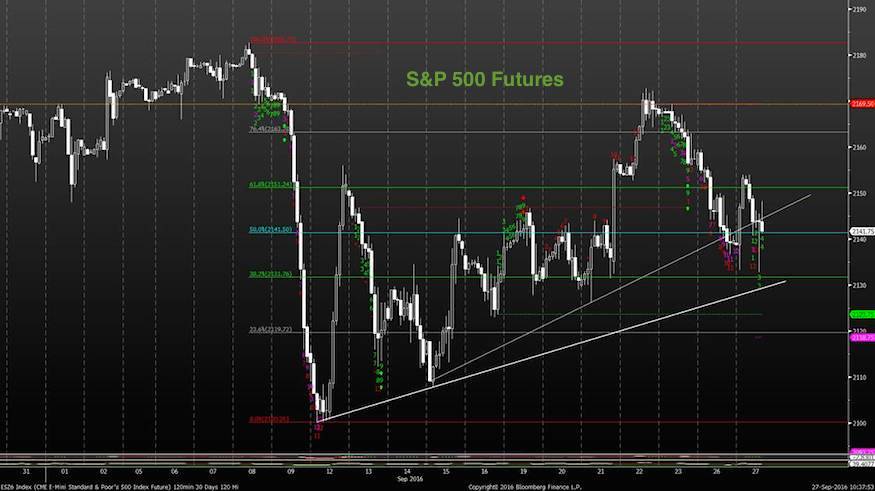
As I’m writing, major stock market indices are reversing back higher. Below is a chart highlighting some key price levels for S&P 500 Futures. As the S&P 500 (INDEXSP:.INX) is the broadest indicator of U.S. equities, it’s highly traded (and tracked) by active investors.
On the downside, the key level to watch is 2131 support on S&P 500 futures. Meanwhile, the key price level on the upside is 2154 resistance.
A break of either one of these levels will likely see continuation in either direction. I continue to think that market pullbacks will be minor. And secondary support lies at 2123.
S&P 500 Futures Chart – Key Trading Levels
Fear jumped substantially ahead of the debate in the last week with Total put/call ratio back over 1. So given the lack of weakness during this seasonally bearish time, that is indeed a positive for stocks. The degree of strength in the Transports sector is also constructive.
Thanks for reading.
Get more trading insights and market analysis over on my blog Newton Advisor. Thanks for reading.
Twitter: @MarkNewtonCMT
Any opinions expressed herein are solely those of the author, and do not in any way represent the views or opinions of any other person or entity.


