The S&P 500 Index, Dow Jones Industrial Average, and Nasdaq Composite all traded lower on Tuesday.
Despite the intense two days of selling, we have yet to see any technical criteria suggesting a crash is imminent.
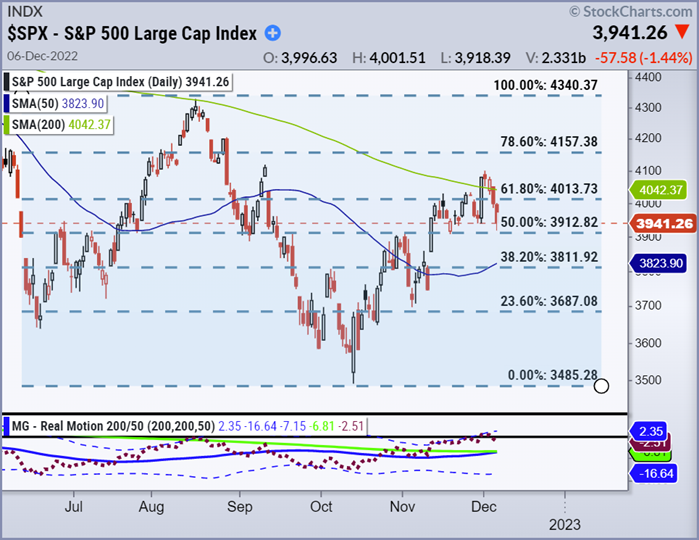
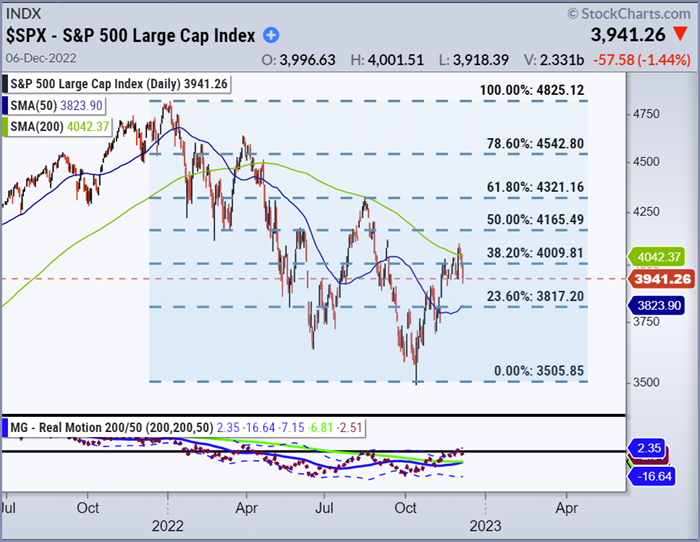
Our Real Motion Trading Indicator above displays downward moderated momentum and forecasted a stalled rally and reversal.
The dots above represent Real Motion (trading momentum) and notice they never cross over the upper Bollinger band.
They then proceeded to retreat lower, telegraphing stalled momentum, and a failed rally attempt.
This same Real Motion pattern is illustrated on each chart.
Last weekend in our weekly Big View commentary, we highlighted that all the indices had nice technical gains.
In addition to our proprietary trading indicators, various momentum oscillators, technical gauges, and market phases there are also retracement levels associated with the Fibonacci sequence that many traders watch so also useful to follow.
They are 23.6%, 38.2%, 61.8%, and 78.6%. These Fibonacci levels correspond to previous support and resistance points.
If the market continues to sell off, these levels will likely come into play to warn of further technical weakness.
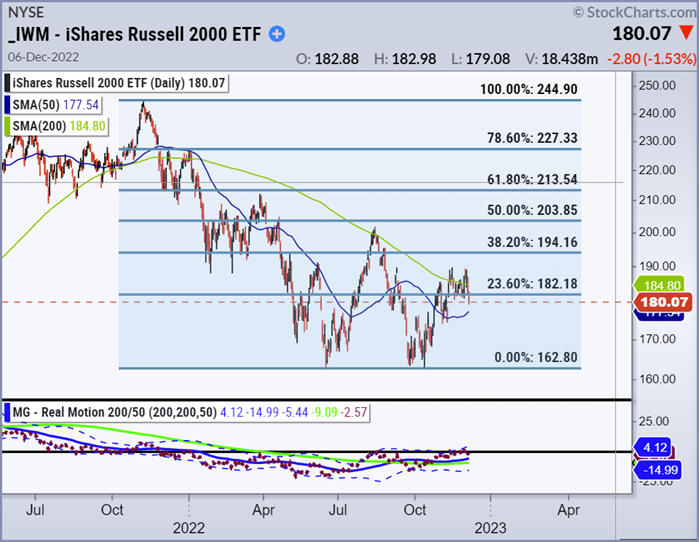
Today, the Russell 2000 also held above the 50-day moving average and found support around the 23.6% Fibonacci level as displayed above.
Remember that having a trading strategy that takes advantage of volatility is your greatest protection, and that retracements are a normal part of the trading process.
Click here to learn more about Mish’s Premium trading service with a complimentary one-on-one consultation.
Stock Market ETFs Trading Analysis & Summary:
S&P 500 (SPY) The 50-week MA looms above as price resistance at 410 – until that clears, this could return to support at the 50-DMA or 380.
Russell 2000 (IWM) Similarly, 190 is resistance and now looking at 177 as support and must hold
Dow (DIA) As only index above the 50-WMA, support at 329 is key.
Nasdaq (QQQ) Still the weakest index. Hovering on major support at 278 or trouble ahead.
KRE (Regional Banks) After weeks of sideways action, this failed with last major support at 57.00.
SMH (Semiconductors) 212 support to hold and if this can lead, then 230 is the place to clear and take notice.
IYT (Transportation) Another one to fail at the 50-WMA. Now, 213 to 214 is key support
IBB (Biotechnology) This has been the year of do not chase the breakouts. Like DIA above the 50-WMA and will see if can holds 127
XRT (Retail) Never got the clearance over 67.00 so now we watch 63 as major support
Twitter: @marketminute
The author may have a position in mentioned securities at the time of publication. Any opinions expressed herein are solely those of the author and do not represent the views or opinions of any other person or entity.

 and Semiconductors (SMH): Concerning Price Pattern?")

 and Semiconductors (SMH): Concerning Price Pattern?")


