The price action of the major stock market indices remains ugly and most of my favorite indicators suggest that more rough sledding could lie ahead.
Despite this, there are many indicators that suggest a very good rally could be in store which will either turn the tide higher or fail miserably, and be followed by a break of the February lows and a big bear market.
So we’re heading towards a crossroads of sorts.
Note that this is only a portion of my “On The Mark” newsletter that went out to my subscribers yesterday. Feel free to reach out to me at arbetermark@gmail.com for inquiries about my newsletter.
Let’s look at a few charts…
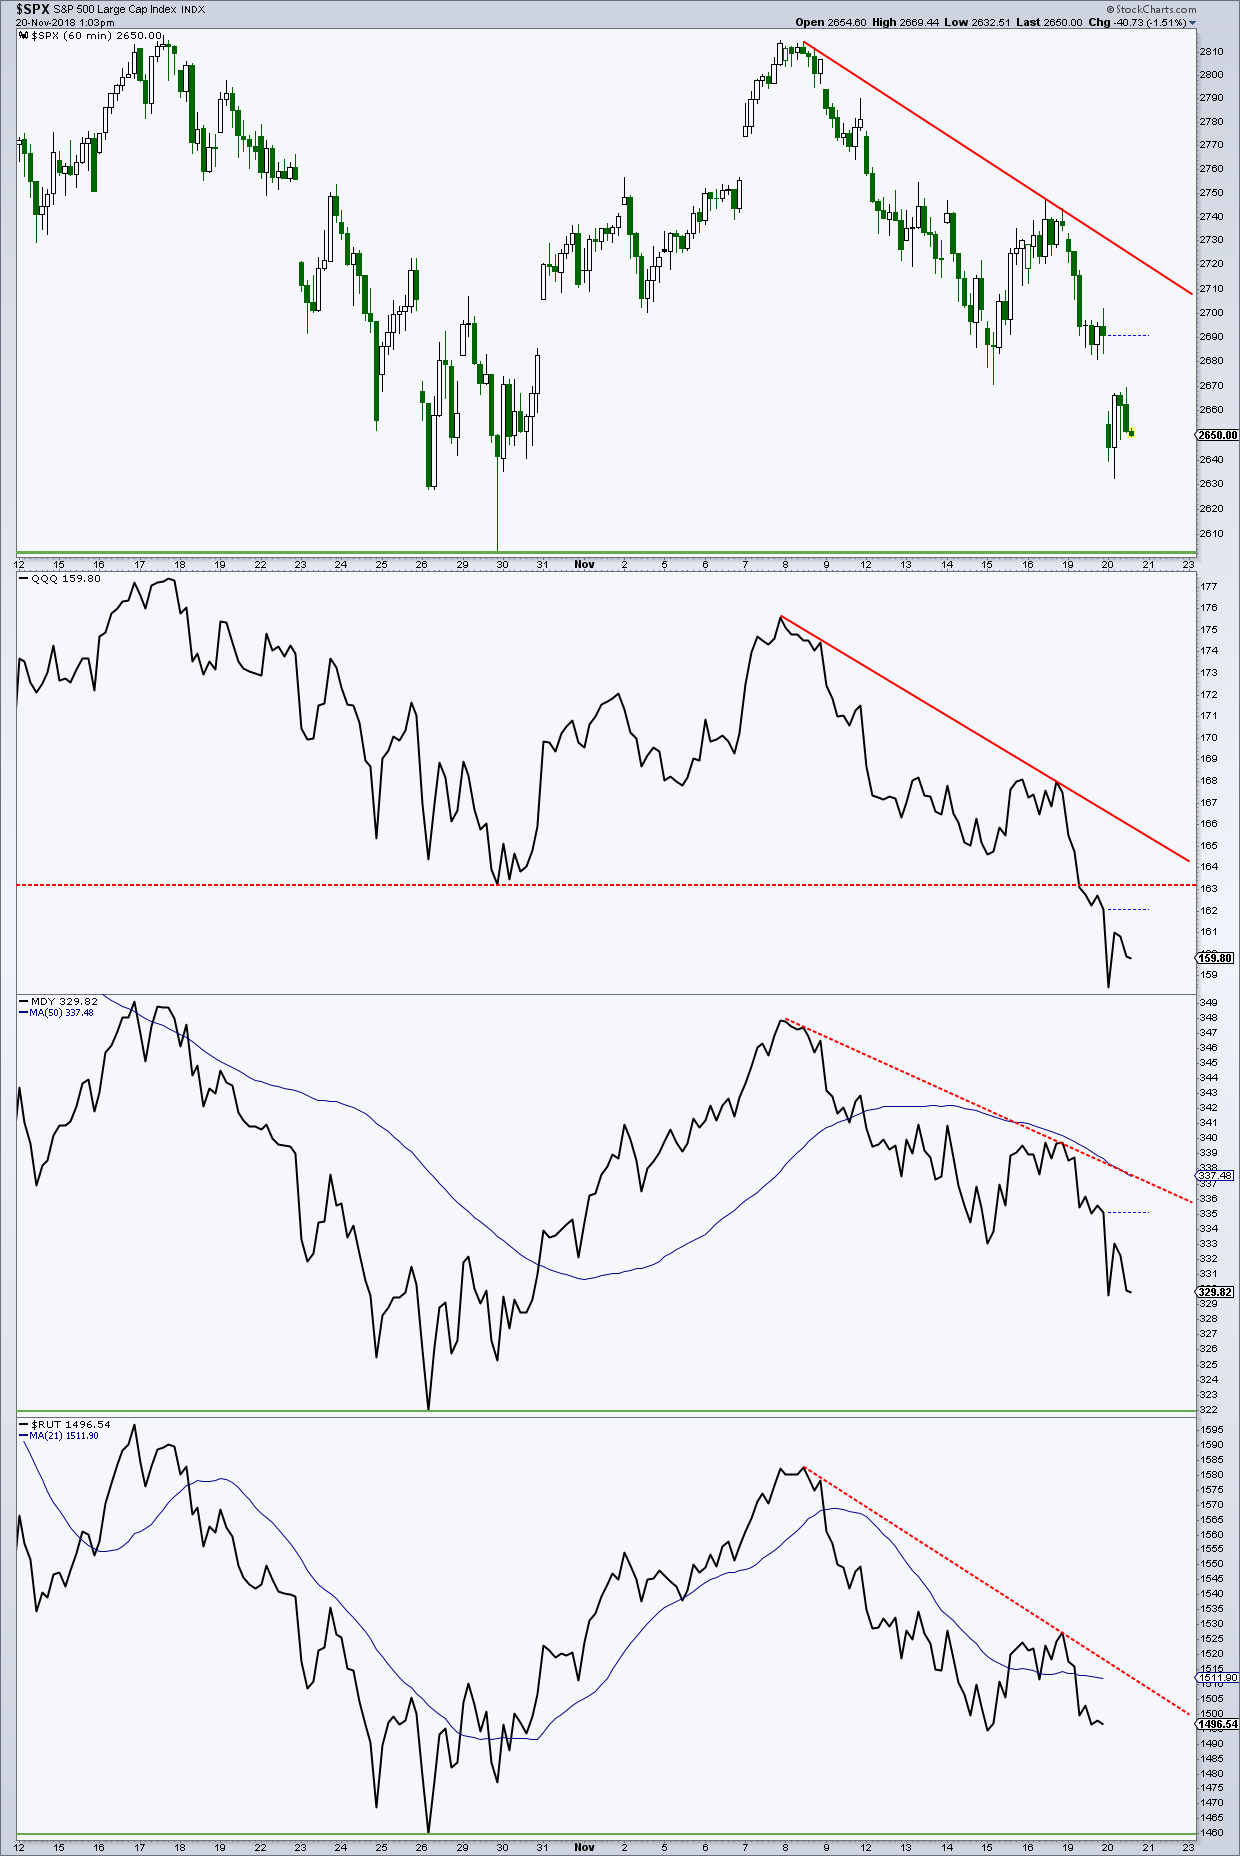
The 1-hour charts below show that the major indices, except the QQQ’s, remain above their late October lows, and all remain in clear downtrends. If the S&P 500 and the small and midcaps fail to hold their recent lows, then the early year lows could be tested and easily taken out.
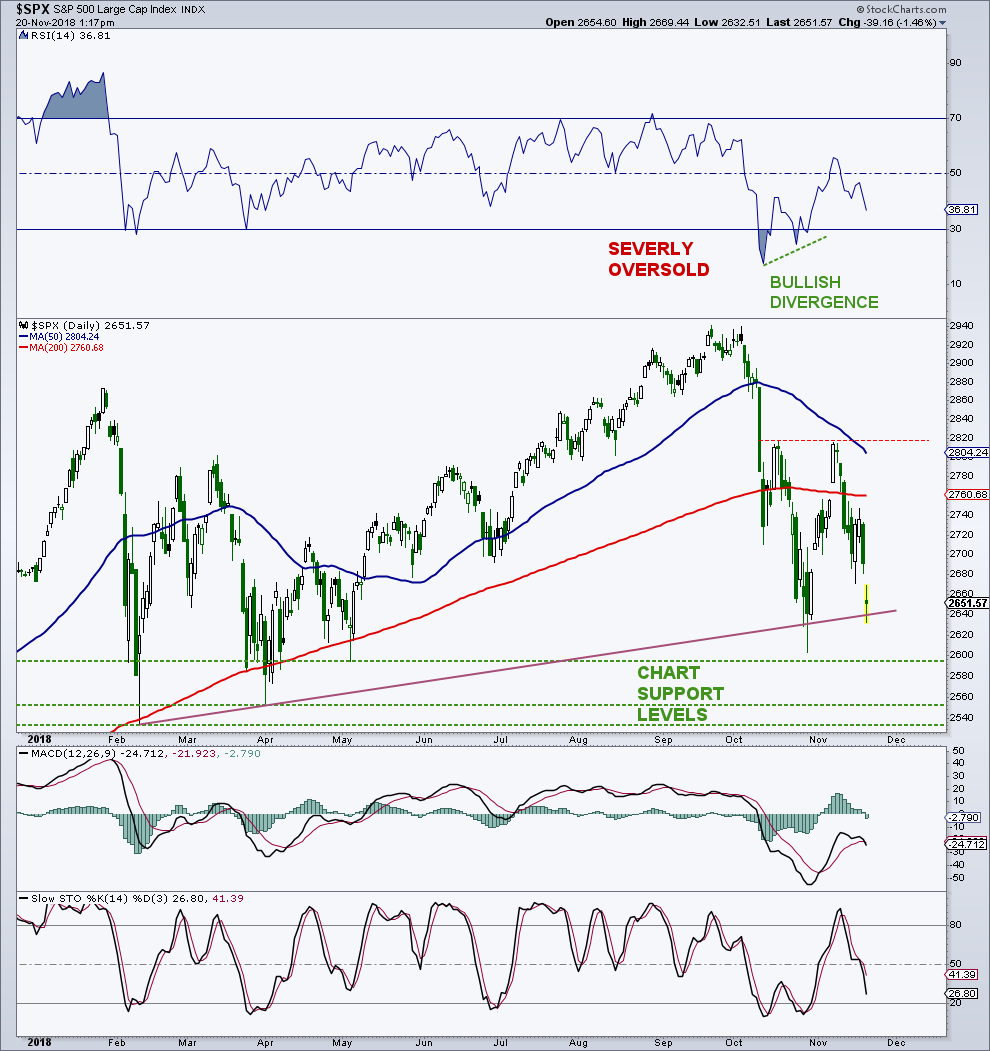
On the daily chart, we have once again entered a very important area of intermediate-term support. Trendline support, off the lows since February, was hit again today. Other chart support levels from the lows earlier this year sit at 2,595, 2,554, and 2,533. As I have said, and for the bullish L.T. case, we do not want these early year lows taken out. A large H&S pattern may be forming, but for some symmetry, you would need one more rally to the 2,800 to 2,900 region to form the right shoulder and then a break of the neckline down near 2,500.
That would open the door for a measured move down to the 2,100/2,200 zone which just happens to be the major breakout area from back in 2016. If we can turn higher in the near term (more than 1/2 to 1 day of price strength), there is little technical resistance overhead.
The “500” could easily and quite quickly get back to its recent highs.
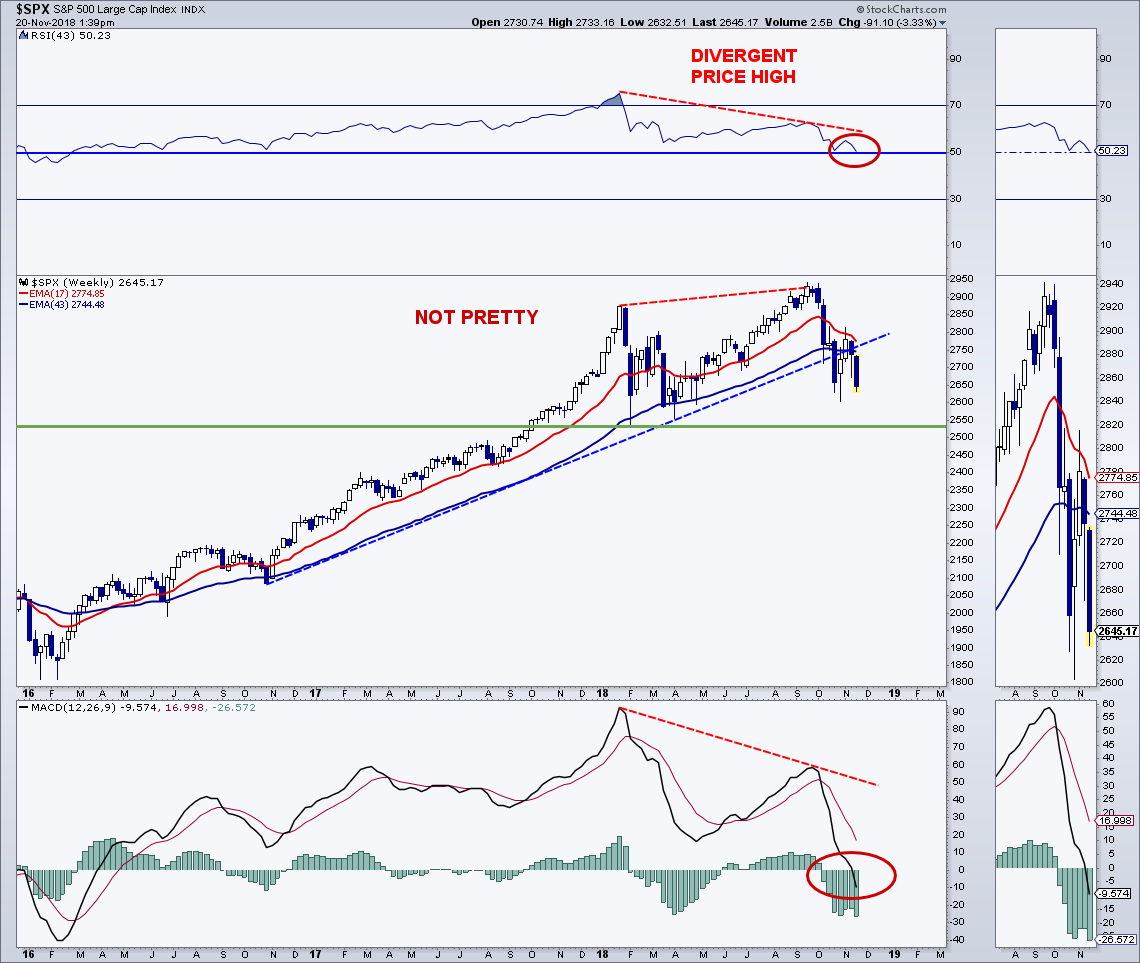
On the weekly chart, about the only positive is that we still have higher highs and higher lows in place. The “500” has taken out trendline support off the lows since 2016 and has lost its 43-week exponential average (EMA). Notice how price held this key average earlier this year.
The 17-week EMA is declining quickly and acted as resistance during the last rally. The shorter average is not far from crossing the longer average, which would be a bearish moving average crossover, and a major I.T./L.T. warning. The 43-week RSI is close to falling below the 50 level, while the MACD is now in negative territory. Generally, most price damage occurs when these momentum indictors are below the mid line.
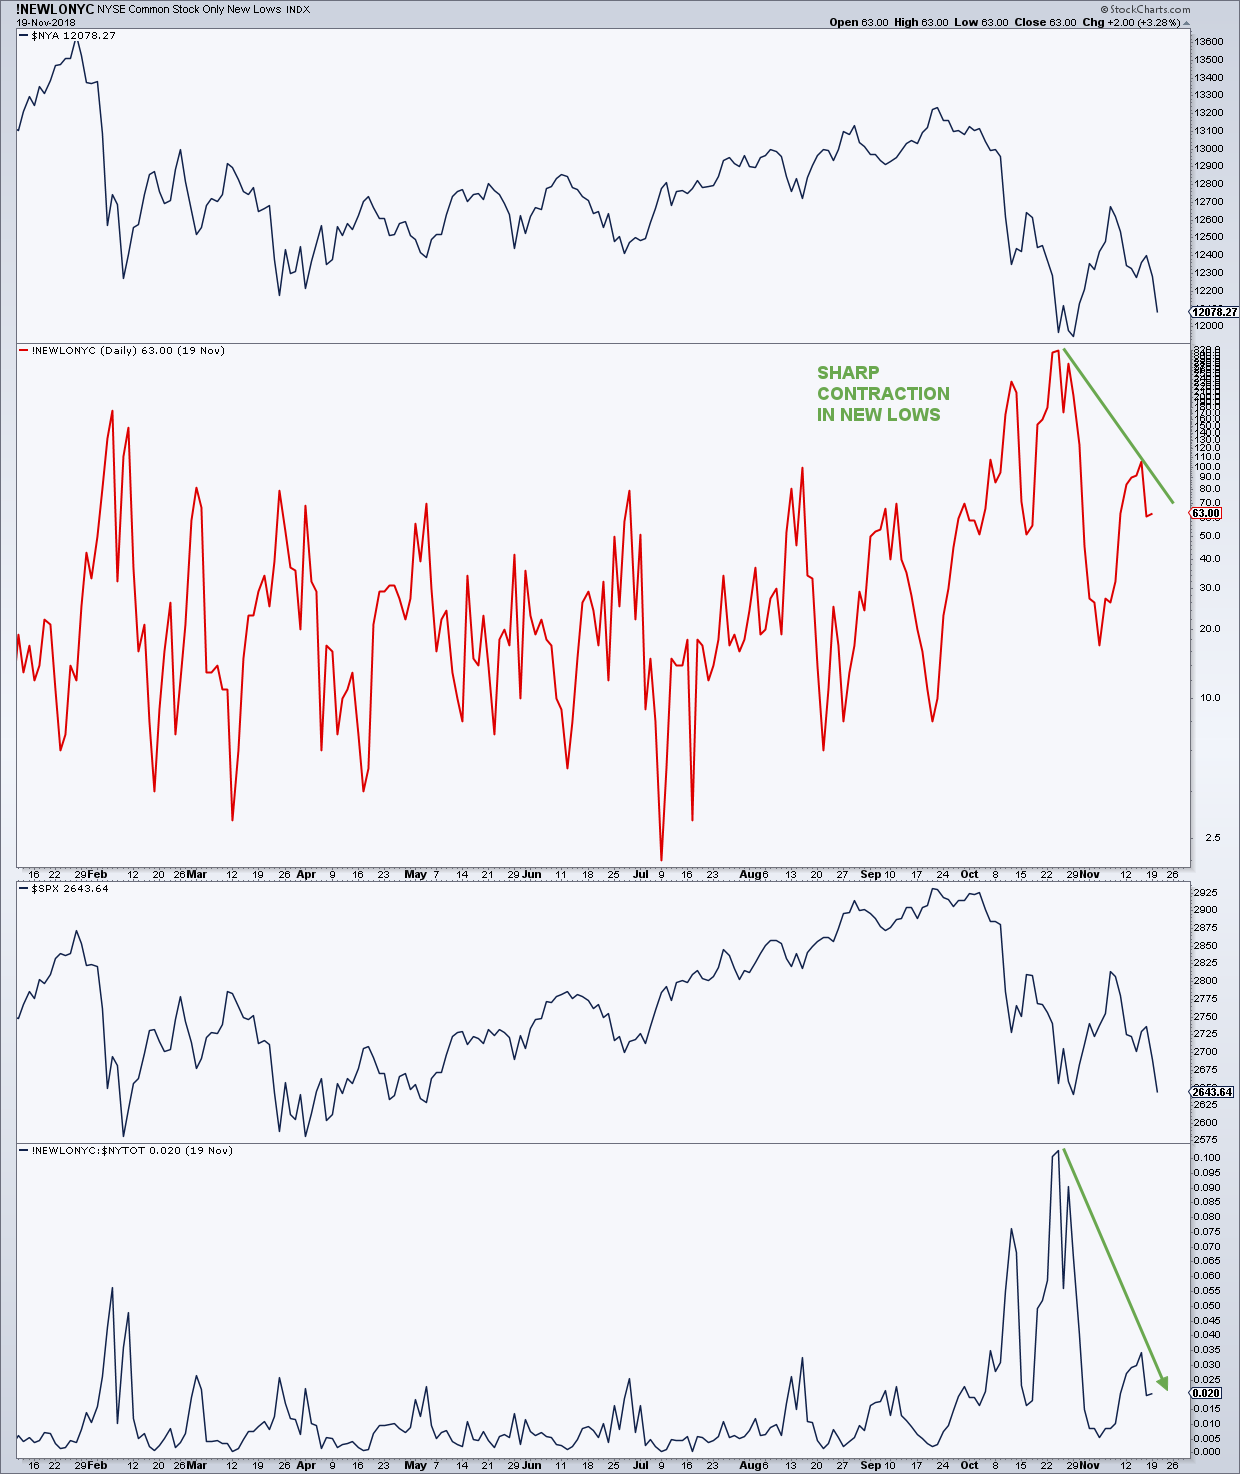
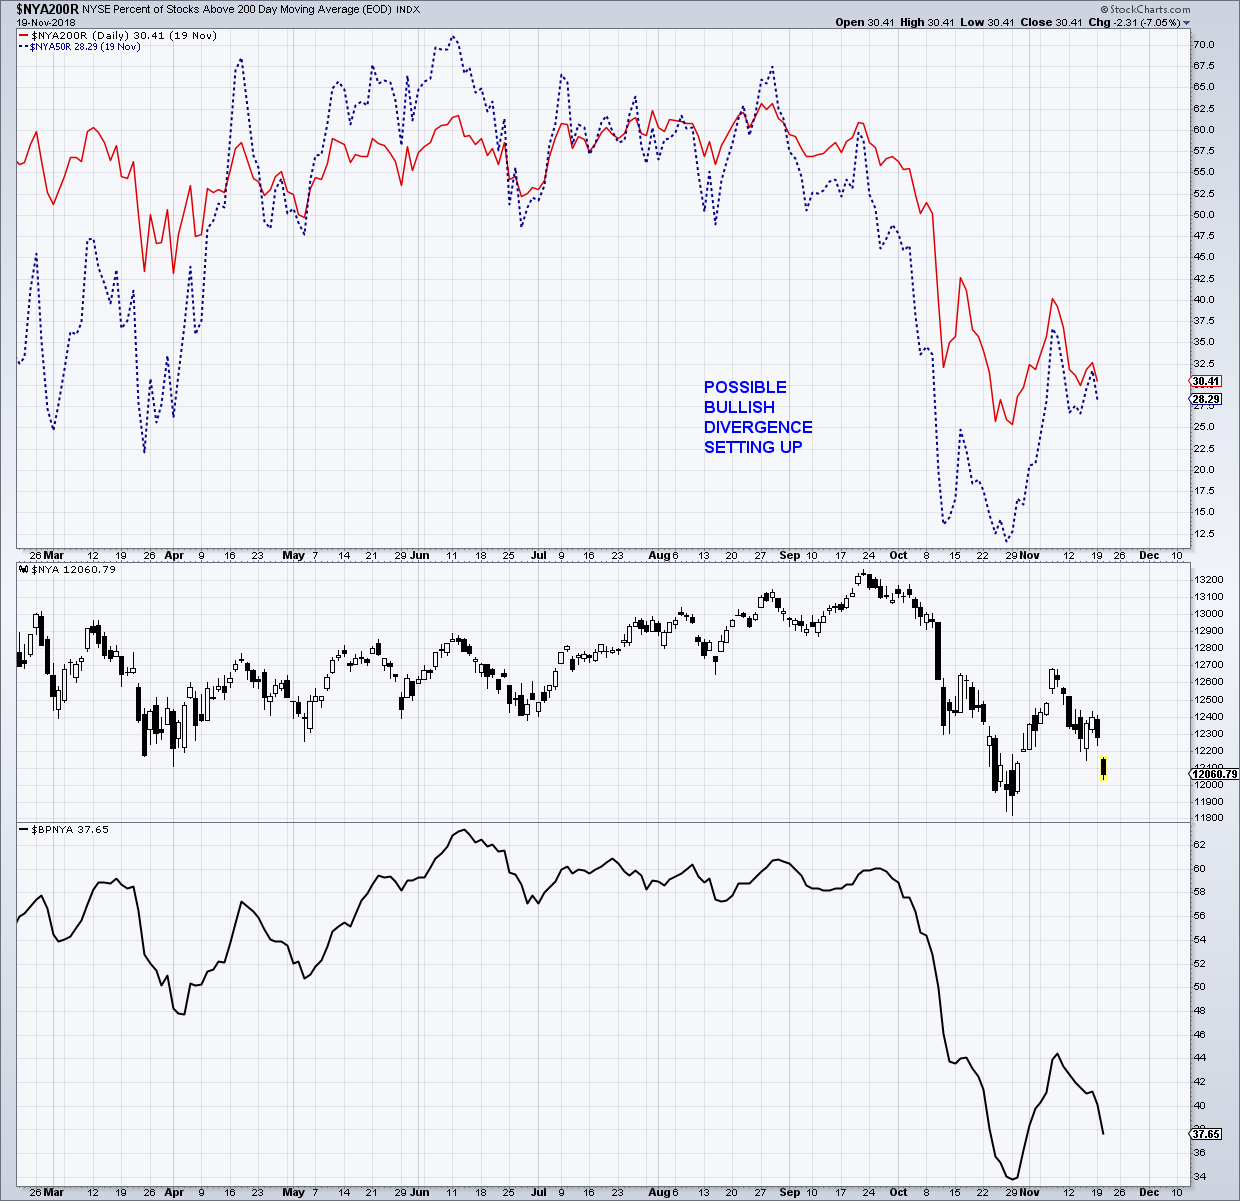
On the positive side, some breadth indicators are showing bullish divergences. New lows on the NYSE (common stock only) have decreased sharply while the NYSE is close to testing its recent lows. This is typically seen at many I.T. bottoms.
There is also a potential bullish divergence setting up with respect to the percent of stocks below their 50-day and 200-day averages on the NYSE. This is also seen at many I.T. bottoms.
The I.T./L.T technical picture remains challenged and a fair amount of our favorite indicators are pointing to more trouble ahead. Based on market breadth and sentiment, we could see a fairly sharp rally in the not too distant future. If this potential rally does not correct the many technical issues that are present, then its possible that the lows from earlier this year will be taken out and the correction turns into a bear market.
Twitter: @MarkArbeter
The author has a long position in Platinum at the time of publication. Any opinions expressed herein are solely those of the author, and do not in any way represent the views or opinions of any other person or entity.


