S&P 500 Index (2-3 Days): BULLISH
The rally looks to be nearing an end given more volume in declining vs advancing, and poor breadth on the latest breakout. That said, the S&P 500 (INDEXSP:.INX) should still be able to reach 2425 up to 2435 before ending. Stay long and look to sell into strength into early next week.
Technical Market Thoughts
Not a very inspiring rally to say the least. The S&P 500’s push to new highs in the last couple days has occurred on very sub-par breadth and volume. Thursday’s stats showed just a fraction more advancing than declining issues, while volume finished more negative than positive (largely due to Energy). Momentum has been lower on this recent stab to new highs than it registered into the March highs, or even late April. So given the ongoing overbought conditions, coupled with counter-trend sells and Financial underperformance, the rally might not get above 2435 on this go-around.
On the positive side of the ledger, it’s worth noting that the Industrials, Discretionary and Healthcare have all joined Technology in the market leadership column. So overall, this still looks positive, and can drive prices higher.
While it’s bullish to see S&P 500 and Nasdaq 100 (INDEXNASDAQ:NDX) back at new highs, it’s important to see Small caps and Transports also begin to rally… and neither of these groups right now are anywhere near new-high territory. Furthermore, the Financials have lagged badly in recent days, as yields have struggled to rise while the yield curve has flattened further.
Overall, while a couple short-term cycles project a turn in late May into early June, it looks like the Industrials move should follow-through to the upside, so betting on an imminent pullback still seems premature. For now, its best to wait for some evidence of this rally failing.
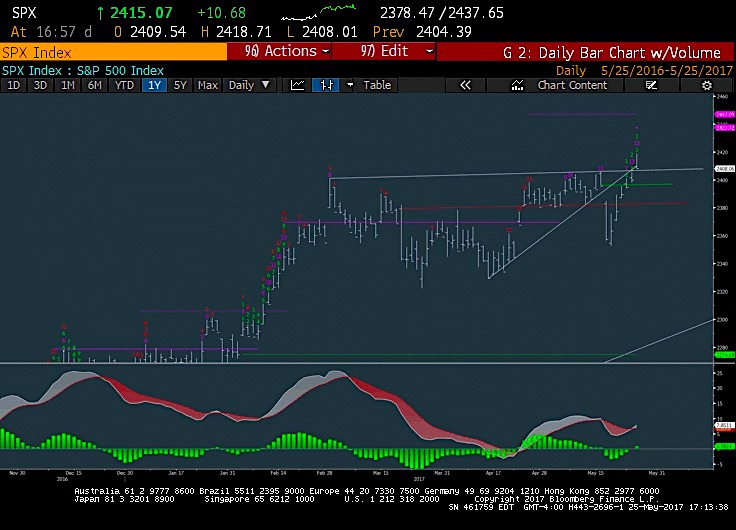
S&P 500 Chart
The S&P 500 pushed up further to new intra-day and record closing highs, even as market breadth dogs the index. Overall, stocks should be near an area that causes some near-term peaks in price as we head into the month of June. Therefore, it’s probably wise to sell further strength into the 2425-35 price area. Counter-trend sells via Demark are close to forming on daily charts in many indices, but still look to be three weeks away on a weekly basis. Therefore, in my opinion any near-term decline should still be buyable until the weekly signals are also complete, and confirmed.
Thanks for reading.
Twitter: @MarkNewtonCMT
Any opinions expressed herein are solely those of the author, and do not in any way represent the views or opinions of any other person or entity.


