 By Andrew Nyquist As the market remains elevated into the end of April, I thought it would be good to take a quick look at the structure and setup for the S&P 500. I’ll plan to follow up with a more granular look at the S&P 500 later today or tomorrow.
On a near-term basis, the index is on day 7 of the rebound rally and currently touching up against the highs (this has many eyeing the possibility of a double top). While this is quite possible, note that the index is also on bar 6 (today) of a daily sell setup — should that continue, it would produce a Friday/Monday peak. And if the highs are exceeded, I’ll be looking for an overthrow to 1611 (1.236 fib).
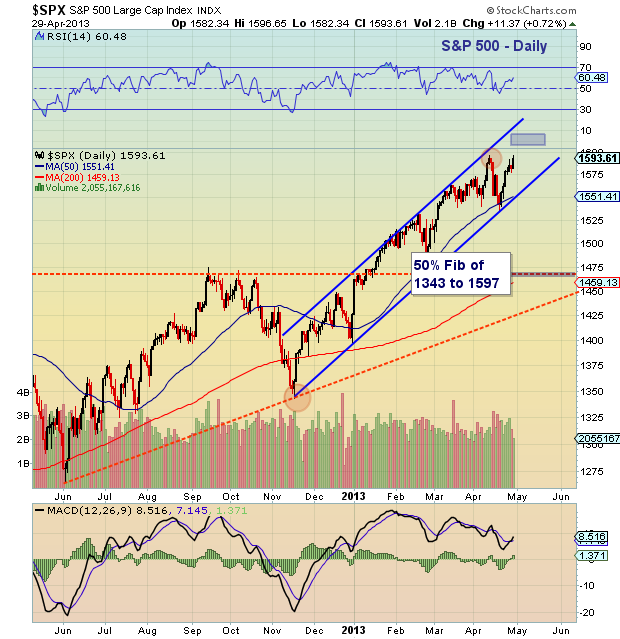
A more macro picture of the S&P 500 highlights the channel trend higher. Note that the trend line coincides with the 50 day moving average, so keep an eye on that. 1540 and 1500 are also supports, while 1470 represents the 50% Fibonacci retracement and major support area. This will bump a bit higher should the index exceed 1597. The 200 day moving average is also in and around that major support.
But, with the trend still in tact, it is prudent to keep your eyes above 1540. Trade safe, trade disciplined.
S&P 500 Daily Chart
Twitter: @andrewnyquist and @seeitmarket
No position in any of the mentioned securities at the time of publication.

: Creating Bullish Divergence?")

: Creating Bullish Divergence?")


