The S&P 500 (SPX) has been in consolidation mode since early March, forming a wedge pattern. Since the longer-term trend is higher, a breakout to the upside seems logical. However, we need confirmation and could continue to see more distribution.
For that reason, I want to highlight some S&P 500 support levels to keep on your radar. If the price action breaks below the lower trend line of the wedge in the near term, a measured move would offer a price objective of 1959.
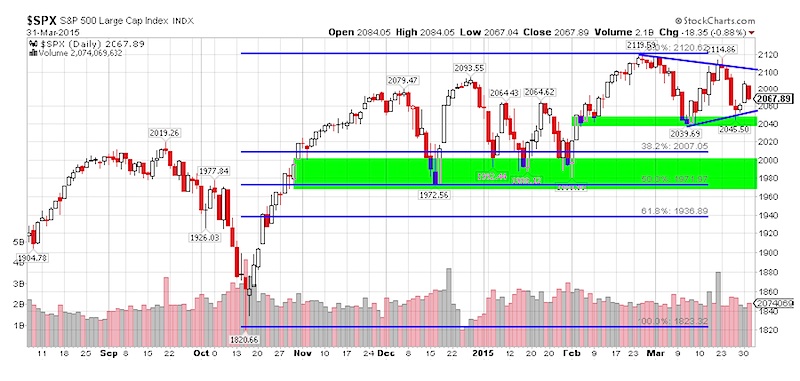
However, looking at the chart, we would have a few S&P 500 support levels to consider along the way. The first level would come into play at 2040. Then there is minor support at 2020 where the S&P 500 gapped higher in early February (open gap). Below 2020 comes a wide support range between 1970 (1972 was the December low) and 2000. This range also offers Fibonacci retracement levels of 38.2% and 50% from the October low of 1820 to the February high of 2119.
Keep in mind most pullbacks occurring over the last two years have been between 3.5-7.0%, which suggests 2040, and 1970 respectively to be on our radar for support.
S&P 500 Support Levels to Monitor
Follow Karl on Twitter: @Snyder_Karl
No position in any of the mentioned securities at the time of publication. Any opinions expressed herein are solely those of the author, and do not in any way represent the views or opinions of any other person or entity.


