S&P 500 Index Trading Outlook (3-5 Days): Bullish
Thursday’s gains should lead to a move back to new weekly highs into the Federal Open Market Committee (FOMC) next week before the markets reverse course.
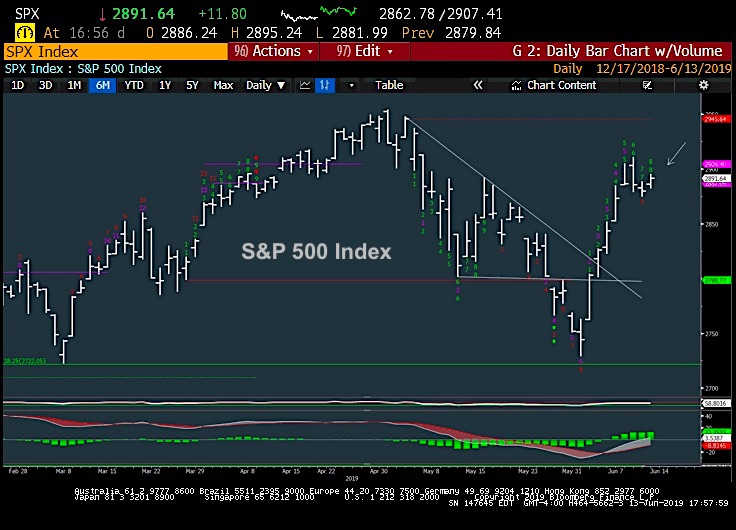
For now, I am bullish on the S&P 500 (INDEXSP: INX) with stops on daily close under 2874 and upside target between 2930-2945.
S&P 500 Chart Analysis
Trend still short-term bullish and move back above 2915 likely into FOMC.
Looking at this week, the SPX sideways motion has now begun to turn back higher, based on Thursday’s gains, and still looks early to turn bearish. While this week’s sideways range has taken a toll on short-term momentum, prices failed to turn down sufficiently to think the market had begun to rollover.
Movement up to 2915 likely and over to 2930-45 which would be an area to sell into if reached Friday into next Tuesday. At present, bullish stance is preferred.
Broad Financial Markets Commentary
US and European markets continued higher Thursday, extending gains and making further strength Friday into next Monday likely before a stallout. ETF’s listed below like XLY, XLK, XLF, and XLI all have targets directly above, and show similar signs of pending exhaustion that will be in place on minor new highs, which could come about as early as Friday. It’s thought that the FOMC decision next week could be a turning point for indices, as these meetings often can be pivotal for markets.
In this case, breadth has been rising, though not as sharply as during previous rallies, and it’s thought that this week’s sideways activity Monday-Wednesday has caused an ever so slight dip in momentum, which should make any move back up above 2915 likely prove short-lived into FOMC before a pullback into the OPEC meeting 6/25. For Friday, further gains still look likely, and it’s right to be bullish.
One item of concern is the degree to which stocks and bonds are now rallying in tandem. This has occurred at various times throughout history, and largely was the case back in March of this year. Yet, given that yields and stocks have trended together more recently in the month of May, this recent divergence likely could mean that one of these moves is wrong.
Technically speaking, US Treasuries still look to continue higher near-term with yield targets at 2.06 down to 2.00% into next week’s FOMC. For Equities, a bit higher prices also looks right, with 2930-45 a definite potential once SPX gets back over 2915. Technically one can make a good case for selling into the stock and bond rally on a bit more strength over the next week. For Treasuries, a few methods point to possible intermediate-term lows in yield being made in mid-June. For stocks, a short-term correction is possible into 6/24-5, but likely would be buyable. Stay tuned.
If you have an interest in seeing timely intra-day market updates on my private twitter feed, please follow @NewtonAdvisors. Also, feel free to send me an email at info@newtonadvisor.com regarding how my Technical work can add alpha to your portfolio management process.
Twitter: @MarkNewtonCMT
Author has positions in mentioned securities at the time of publication. Any opinions expressed herein are solely those of the author, and do not in any way represent the views or opinions of any other person or entity.


