 By Andrew Nyquist
It been a chop and drop, grind lower type of market. And for traders, that’s tough… especially those trying to enter swing long positions. That’s why it’s important to understand when and why cash is king, as well as learning some basics around shorting or hedging.
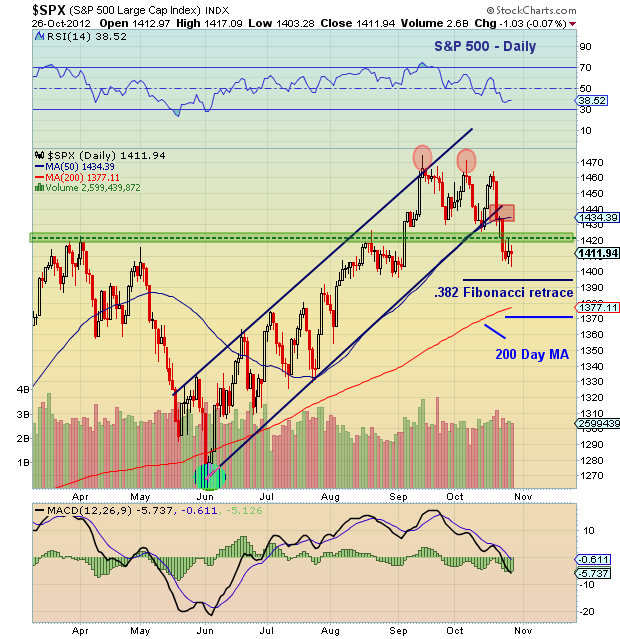
That said, a closer look at the chart of the S&P 500 shows that the index is still holding above 2 important short term support levels.
1) 1394 — the 38.2% Fibonacci retrace level
2) 1370-1375 — the 50% Fibonacci retrace level and 200 day moving average zone
Although it looks like one or both of these levels will be tested next week, active investors should focus in on their trading plans and build positions according to their own risk profile. Note that Monday is bar 7 of a DeMark Buy setup 9.
Trade safe, trade disciplined.
More charts found here.
S&P 500 price chart as of October 26, 2012. S&P 500 chart with technical analysis and DeMark buy setup count. S&P 500 stock market index analysis for month of October.
———————————————————
Twitter: @andrewnyquist and @seeitmarket Facebook: See It Market
Position in S&P 500 related SPY at the time of publication.
Any opinions expressed herein are solely those of the author, and do not in any way represent the views or opinions of his employer or any other person or entity.


