The S&P 500 Index is nearing its all-time highs. And the S&P 500 ETF (SPY) is at all-time highs (dividend adjusted). Either way, the stock market is nearing a critical juncture.
Below are 10 things that I’m considering when looking at $SPY… and the market’s battle for all-time highs.
1. The surprisingly bad job’s report released on Friday was initially sold off, but then recovered and rallied back to erase the majority of morning losses.
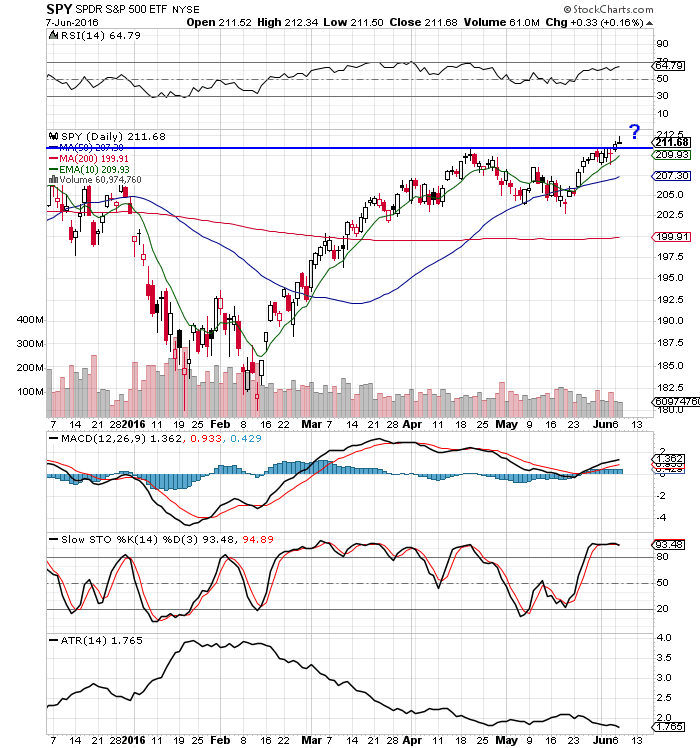
2. The S&P 500 ETF (SPY) traded around a $208.85 support and a $211 resistance level last week in $SPY. This is a good price base to build, setting up another run to higher levels. This market continues to be a buy the dip and sell the rip until $SPY closes over $211. So are we there yet?
3. The all-time highs (on $SPY div adjusted chart) continued to hold as resistance last week. The more times a key level is tested, the higher the probability that it will breakout. Above resistance, the only selling pressure will be profit taking, so it’s possible to create a new trading range above all-time highs as short sellers cover and position holders let their winners run. There is a high probability that we will see a $SPY break out to new all-time highs this week and hold.
4. The S&P 500 ETF ($SPY) continues to trade bullishly over all key moving averages: 10 day EMA, 50 day SMA, and 200 day SMA.
5. The 64.79 RSI is bullish and gives $SPY room for higher prices before becoming overbought.
6. The MACD is still under a bullish crossover.
7. The ATR continues to decline, which is bullish.
8. Slow Stochatistics has gone sideways, demonstrating that $SPY is short term rangebound.
9. Last week, $SPY had high volume down days and low volume up days while trading inside the price range. The absence of sellers under $208.86 has been positive for bulls.
10. In the short term, the market upside is limited around the $SPY 70 RSI, but we could see long term moves into new all-time highs this year if $SPY doesn’t pullback or correct.
S&P 500 ETF ($SPY) Chart
Thanks for reading and good trading out there.
Twitter: @SJosephBurns
Read more from Steve on his blog NewTraderU.
Any opinions expressed herein are solely those of the author, and do not in any way represent the views or opinions of any other person or entity.

: Creating Bullish Divergence?")

: Creating Bullish Divergence?")


