S&P 500 Index Futures: Prices snapped back after holding where they needed to.
In last week’s “Weekly Technical Perspective”, I discussed how I thought near-term trading lows were right around the corner – that proved correct.
That said, we now face a more challenging call heading into this week.
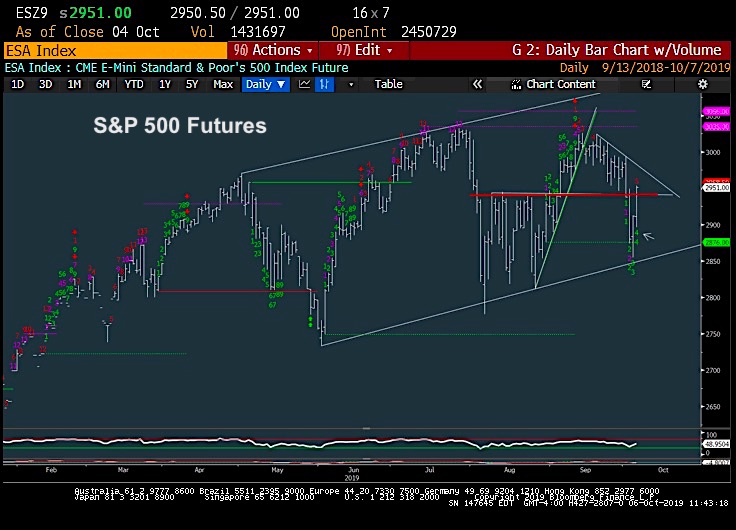
The S&P 500 has bounced nearly 100 points off the lows and is back up above 2940. This is important and positive, as the area from 2940 was breached only for about 2 days time and failed to make a weekly close under.
Yet, the trend from mid-September remains negative and prices remain well under July lows. (The NASDAQ Composite actually broke the uptrend from Spring lows and has not yet regained)
Thus, it’s thought that progress can continue over the next week to build on Thur/Friday success of last week. Yet, it’s going to be important to see the downtrend from this past September exceeded. A 3-5 day bounce that fails to make this progress and then stalls would be a concern heading into mid-October, a time when cycles historically over the last 20, 30, 40, 60, 100 years have peaked. At present, one should be long for this week, using weakness to buy, favoring specifically stocks like AAPL within Technology.
Short-term (3-5 days): Bullish
Last week’s late surge helped S&P rally nearly 100 points to get back over 2940, while the early week decline failed to show serious deterioration, holding where it needed to. While near-term overbought on hourly charts, we’ve had some good price action and breadth to end the week, and it’s thought that indices can build on this into mid-October.
Thus, any near-term early week pullback likely should prove buyable for a further push higher. One should still consider a long bias to be correct in the short run unless S&P were to violently erase both Thur/Friday advances of last week, undercutting 2855. Barring this, which seems unlikely this week, near-term weakness is likely buyable, and given AAPL’s technical attractiveness as our key anchor within Technology, further strength looks to happen this coming week.
Intermediate-term (3-5 months): Neutral
Price trends continue to show a gradually waning long-term trend, and it’s thought that October could still potentially experience more downside before a year-end rally. 2 things which are thought to be positives for stocks between now and End of year thus far: 1) a pronounced LACK of weakness thus far.
Markets gave back 6-7% before snapping back and bouncing into September 2) Sentiment remains somewhat dismal, despite prices being near all-time highs. Ongoing trade tension and policy uncertainty along with concerns about global economic weakness, not to mention an impeachment inquiry just ahead of an Election year are factors which are serving to create a cloud of indecision and general bearishness
So given just a 6% decline from late July, we’ve already seen a fairly pronounced uptick in fear, and this likely results in declines finding support much quicker than normally would happen. Many will rightfully believe that a market decline will start to act as a larger drag on the economy, and they very well could be right into next year, with tariffs serving as the key catalyst for investors and corporations to start pulling back.
As mentioned in prior reports, the chief concern on an intermediate-term basis revolves around the “flattening” out of this rally which has been pretty plain to see given momentum indicators on weekly and monthly basis. While longer-term uptrends remain intact, momentum has told a much different story, and slowly but surely illustrates a rally losing steam. Chronic overbought conditions from back in January 2018 have never been revisited, and despite the push to new highs, we’ve witnessed lower and lower peaks in momentum. Historically this has proven problematic for stock indices and typically is present at market peaks.
While the Advance/Decline line has largely been trending near highs, we have seen some withering in this also in recent weeks and it’s thought that the A/D line is topping for the Fall. The Summation index largely peaked out in February of this year, and we’ve seen the number of stocks hitting new 52-week lows start to increase off low levels in July. Overall, not too much to go on which would cause one to avoid markets just yet, but it’s thought that the balance of the year likely turns out to be largely flat with where prices are now. Declines in late October into November should give way to a year-end rally. Yet, the decline likely will be made back by end of year, but not without further damage to the intermediate-term momentum that will continue to plague the market into next year.
If you have an interest in seeing timely intra-day market updates on my private twitter feed, please follow @NewtonAdvisors. Also, feel free to send me an email at info@newtonadvisor.com regarding how my Technical work can add alpha to your portfolio management process.
Twitter: @MarkNewtonCMT
Author has positions in mentioned securities at the time of publication. Any opinions expressed herein are solely those of the author, and do not in any way represent the views or opinions of any other person or entity.


