The S&P 500 Index (INDEXSP: .INX) finished the month of February up 3 percent.
That’s bullish, especially considering that January was up 7.9%.
But this all follows a nearly 20% decline into Christmas Eve. So investors need to pay attention here and have a plan.
Two weeks ago, I wrote an update on the S&P 500 after it tagged the 200 day moving average around 2740. Although I thought incorrectly that an initial break above the 200-day MA would fail and reverse, I did point out the importance of the resistance zone of 2790 to 2810. And that’s held us in check for 8 trading days. Let’s take another look.
Note that the following MarketSmith charts are built with Investors Business Daily’s product suite.
I am an Investors Business Daily (IBD) partner and promote the use of their products. The entire platform offers a good mix of technical and fundamental data and education.
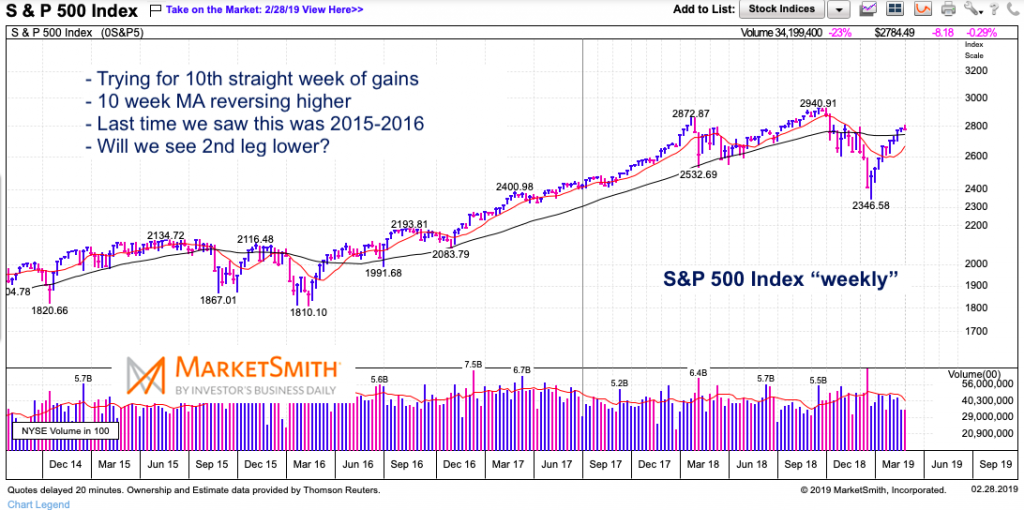
S&P 500 “Weekly” Chart
On the weekly chart, we can see that the index is going for its 10th consecutive week of gains. That’s incredible. The 10 week moving average is rising and we are above the 40 week moving average. Bullish intermediate term posture.
The VIX has fallen back to the 13-15 range, levels not seen since October. With Volatility compressing (and the Ides of March on the way), we could see some reverberations come mid-March.
The S&P 500 index will complete bar 7 of a 9 Demark sell setup this week. A new high next week (or the week after) is necessary for this setup to complete. This could imply the beginning of a pullback and an uptick in volatility by the end of March.
We saw similar (though not as strong) price action during the 2015-2016 stock market recoveries. But it wasn’t until the 10 week MA crossed the 40 week MA that the rally was confirmed.
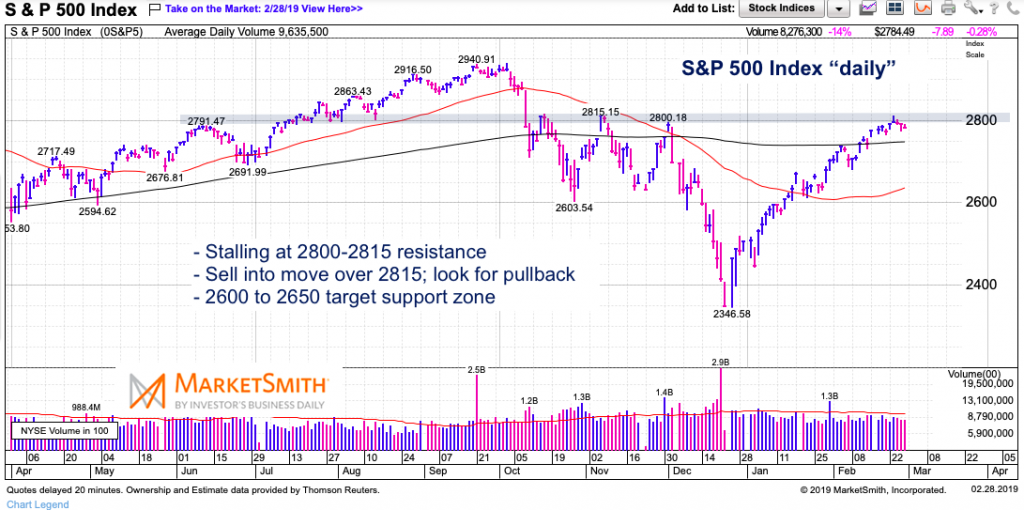
S&P 500 “daily” Chart
Here’s a better look at the resistance zone that has brought about some consolidation (2790 to 2815). A move over 2815 could push up to 2900, but that would likely be an opportunity for active investors / traders to sell into as the V bottom gets a quick reset. Perhaps this will coincide with a “sell the news” trade deal announcement…
At any rate, the 200 day MA is initial support on any pullback, followed by 2600-2650.
Twitter: @andrewnyquist
The author does not have a position in mentioned securities at the time of publication. Any opinions expressed herein are solely those of the author, and do not in any way represent the views or opinions of any other person or entity.


: Showing Some Signs of Emerging Strength")
