Stock market futures considerations for March 8, 2017
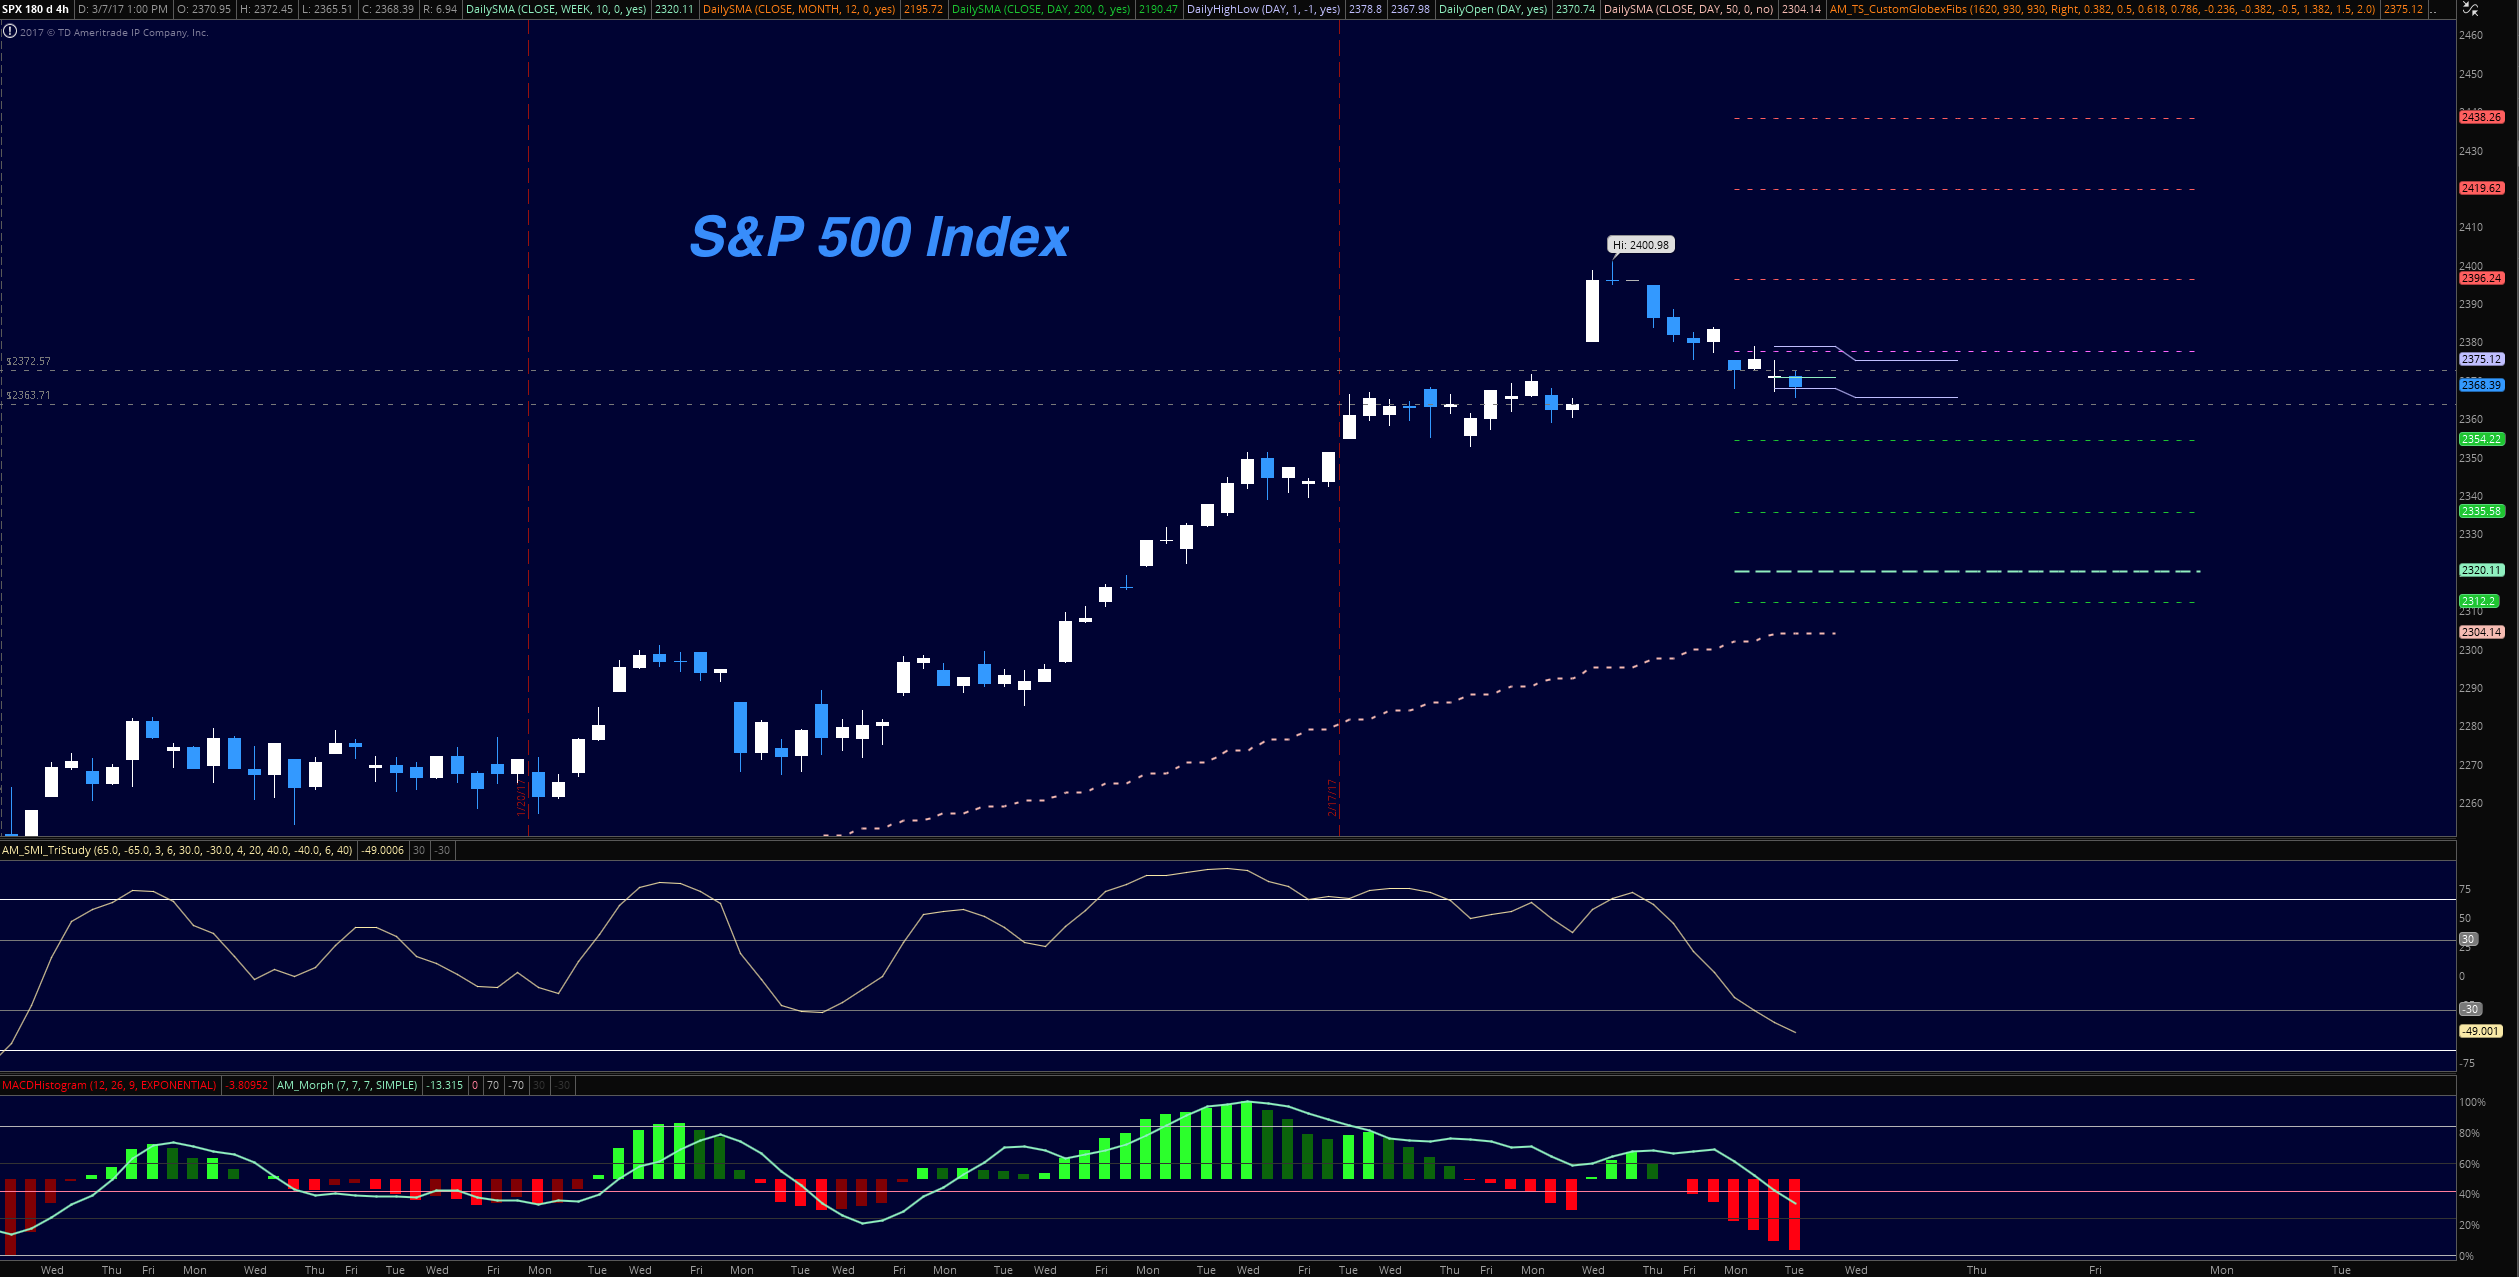
The support levels were tested early this morning and dipped into 2359.5 before bouncing around 2365. The markets have discounted the interest rate rise (most likely) coming next week. I suspect that the S&P 500 (INDEXSP:.INX) tries to stabilize and trades a choppy range.
Buying pressure will likely strengthen above a positive retest of 2370.5 while selling pressure will strengthen with a failed retest of 2355.5.
Price resistance sits near 2375.5 to 2380.75, with 2389.5 and 2403.75 above that. Price support holds between 2360 and 2357.25, with 2355.5 and 2351.25 below that
See today’s economic calendar with a rundown of releases.
TRADING SETUPS
E-mini S&P Futures
Upside trades – Two options for entry
- Positive retest of continuation level -2367.75
- Positive retest of support level– 2361.25
- Opening targets ranges – 2366.5, 2372.5, 2375.75, 2380.5, 2382.75, 2385.75, 2389.5, 2393.5, 2397.75, 2400.5, 2404, 2411.75
Downside trades – Two options for entry
- Failed retest of resistance level -2372.5
- Failed retest of support level– 2364.5
- Opening target ranges – 2370.75, 2367.75, 2365, 2361.5, 2358.75, 2354.5, 2351.5, 2346.25, 2343.25, 2337.5, 2334, 2329.25
NASDAQ Futures
The NQ_F tested lower support regions before a bounce back into resistance near 5355, right around congestion. Charts will likely bounce around the range bound regions between 5331 and 5374.
- Buying pressure will likely strengthen with a positive retest of 5374.75
- Selling pressure will strengthen with a failed retest of 5331.25
- Resistance sits near 5374.75 to 5382.75, with 5392.5 and 5398.25 above that
- Support holds between 5331.25 and 5324.25, with 5319.5 and 5311.75 below that
Upside trades – Two options
- Positive retest of continuation level -5357.25
- Positive retest of support level– 5348.25
- Opening target ranges – 5353.25, 5356.75, 5361.25, 5364.5, 5370.75, 5374.75, 5382.75, 5388.25, 5398, 5404, 5411.5, 5422.25
Downside trades- Two options
- Failed retest of resistance level -5356
- Failed retest of support level– 5344.25
- Opening target ranges – 5353.5, 5349.25, 5344.75, 5337.75, 5333.25, 5327.75, 5324.75, 5319.75, 5312.75, 5306.5, 5297.75, 5294.25, 5291.25, 5286.75, 5277.75
Crude Oil –WTI
Oil charts are testing a key area of support this morning. Buyers should step in but traders should have a difficult time breaching resistance near 53.4. The EIA report is out this morning – differences between the API and EIA will move the chart though only into the bigger range.
- Buying pressure will likely strengthen with a positive retest of 53.86
- Selling pressure will strengthen with a failed retest of 52.5
- Resistance sits near 53.86 to 54.27, with 54.56 and 55.05 above that.
- Support holds between 52.5 and 52.2, with 51.64 and 51.4 below that.
Upside trades – Two options
- Positive retest of continuation level -53.46
- Positive retest of support level– 52.94
- Opening target ranges – 53.02, 53.23, 53.42, 53.76, 54.05, 54.25, 54.4, 54.54, 53.68, 53.88, 54.05, 54.19, 54.54, 54.85, 55.04, 55.12, 55.48, 55.68, 55.88, 56.04
Downside trades- Two options
- Failed retest of resistance level -53.24
- Failed retest of support level– 52.48
- Opening target ranges – 53.07, 52.92, 52.78, 52.63, 52.4, 52.14, 52.01, 51.91, 51.72, 51.52, 51.22, 51.04, 50.82, 50.47, 50.3, and 50.16
If you’re interested in the live trading room, it is now primarily stock market futures content, though we do track heavily traded stocks and their likely daily trajectories as well – we begin at 9am with a morning report and likely chart movements along with trade setups for the day.
As long as the trader keeps himself aware of support and resistance levels, risk can be very adequately managed to play in either direction as bottom picking remains a behavior pattern that is developing with value buyers and speculative traders.
Twitter: @AnneMarieTrades
The author trades stock market futures every day and may have a position in mentioned securities at the time of publication. Any opinions expressed herein are solely those of the author, and do not in any way represent the views or opinions of any other person or entity.


