Stocks are getting hit hard today across the board, with the S&P 500 Index (INDEXSP:.INX), Dow Jones Industrials (INDEXDJX:.DJI), and Nasdaq Composite (INDEXNASDAQ:.IXIC) all down over 1 percent each at the time of this publication.
Here’s a mid-day stock market update and trading outlook.
S&P 500 Update & Trading Outlook
If the S&P 500 closes under 2381 by today’s close, then weakness should continue. IF we hold this level, however, weakness may be postponed. If stocks don’t firm up soon, the S&P 500 may weaken further into month end. But this looks to be short-term in nature and not a serious correction. Look for me on CNBC later today to discuss current state of market.
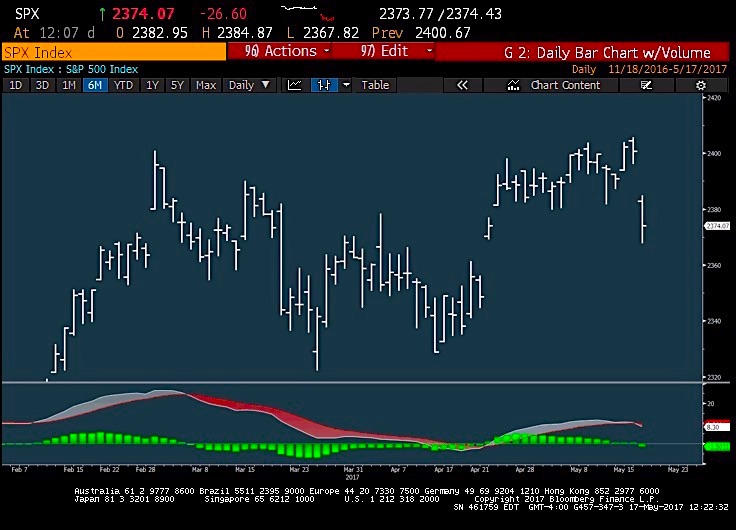
S&P 500 Support Levels To Watch: 2322 and March/April lows; then 2290-2305
Today’s move was rather unexpected. After a huge period of non-volatility, today provided the energy that breaks that wide open. (Think of a coiled spring that has just been let loose). 15 straight days of closing within 0.50% of prior days close (the longest string since 1968 according Ryan Detrick of LPL).
When things like this suddenly END, they don’t normally just snap right back.
Here’s a list of positives and negatives from macro trading position:
Positives:
- Advance/Decline still within striking distance of April highs.
- Long-term structure intact.
- Technology still working well , along with industrials, discretionary, and health care.
- Sentiment. – Economic reasons for bullishness. But marketwise, still some negativity based on DC drama.
- VIX low- Likely FRUSTRATION and low volatilty. Not complacency.
Negatives:
- Near-term trend violation- Short-term support broken.
- Breadth/participation- Rally being carried by a few. Mid-caps have not broken out to new highs, nor have Small-caps. But AAPL goes up every day.. Less than 60% of all stocks are above their 50-day ma and 200-day.
- Financials rolling over.. relatively speaking hitting new weekly lows- YIELDS led this down last FRIDAY- now stocks following suit.
- Very overbought.
- 20-week cycle suggests downward bias .
- Tech VERY OVERDONE. And nearing resistance- if TECH peaks and Financials roll over that would be 38 percent of the S&P 500.
- Seasonality.
Get more of my ideas and daily trading insights over at Newton Advisor.
Thanks for reading!
Twitter: @MarkNewtonCMT
Any opinions expressed herein are solely those of the author, and do not in any way represent the views or opinions of any other person or entity.


