Key Takeaways: Near-term price action has stabilized on the S&P 500 and indications are for another rally attempt.
Short-term sentiment indicators point to some degree of investor nervousness (short-term bullish) but longer-term measures reflect complacency (a growing concern, though difficult to time).
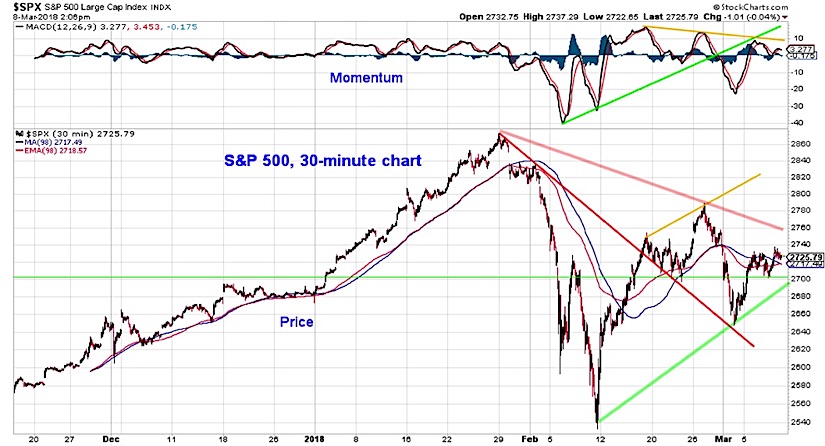
The short-term chart of the S&P 500 reflects continued consolidation – a lower high in February was followed by a higher low in March. We are watching for a breakthrough of either the trend line off of the highs or the trend line off of the lows for indication of the next meaningful move for stocks. Futures indications point higher.
For now, swings within the range between 2700 and 2760 is little more than noise. If we get through 2760 today,that will be notable short-term.
There as been a lack of broad market confirmation via momentum on a weekly basis so this argues for continued caution/discipline. The recent gains in small-cap stocks and the new highs from the broker/dealer index has been encouraging and could lead to improving conditions for the S&P 500.
With volatility returning with gusto in 2018 (the S&P 500 has already experienced 16 daily moves of 1% or more this year, twice what was seen in all of 2017), keeping track of both breadth market trends and investor sentiment will be of heightened importance this year.
After discussing breadth in some detail last week, this week we will attempt to re-cap the current state of investor sentiment. Overall, while there is (in some cases significantly) less optimism than was seen as stocks worked to new highs in January, pessimism remains relatively muted. Note this was written before Friday’s market open, and the market has since rallied higher.
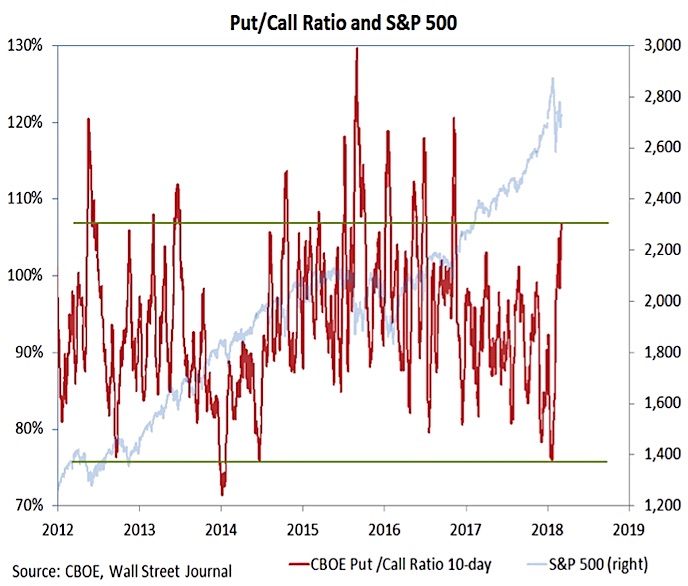
Short-term sentiment indicators reacted quickly to the February stock market weakness. Since January, the 10-day CBOE put/call ratio has surged from its lowest level since 2014 to its highest level since late 2016. In fact, this ratio is one of the few sentiment indicators we track that shows outright and excessive pessimism. There are two caveats here: in the past, significant peaks in the put/call ratio have been well above current levels, and while overall demand for puts relative to calls has been robust, the equity put/call ratio has not shown the same level of concern in recent trading sessions (recording three consecutive readings below 60% this week).
The NDR Trading Sentiment Composite, which incorporates put/call ratios and a number of other short-term sentiment indicators, showed an initial move from excessive optimism to extreme pessimism. While getting into the pessimism zone, the composite stopped short of the lows reached prior to 2017. Moreover, the stay in the pessimism zone was short-lived. Based on this composite, sentiment now is considered neutral. Over the past 11+ years, stocks have struggled to make headway overall when sentiment is outside of the pessimism zone.
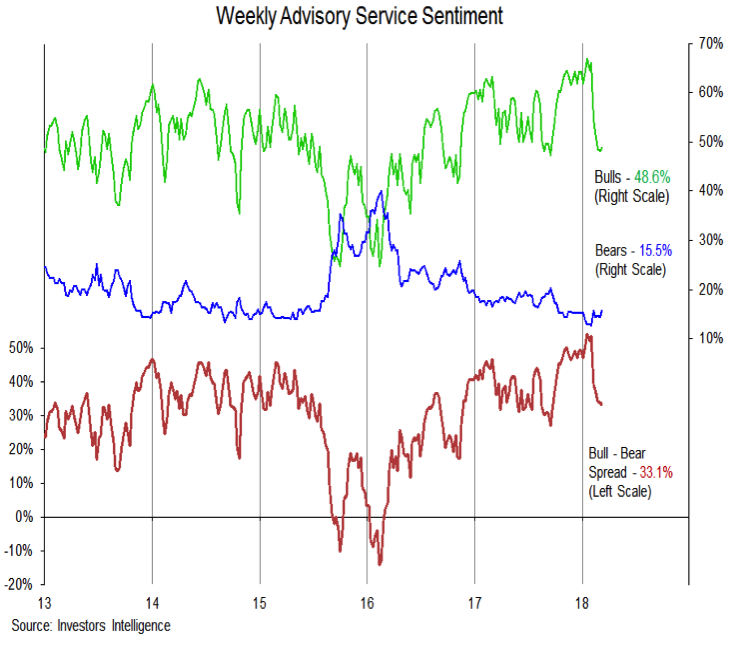
There is even less evidence of pessimism when looking at the weekly survey data. The Investors Intelligence survey shows that bulls have pulled back from the 30-year high reached in January, but the current reading of 48.6% is hardly evidence that bulls have capitulated. Meanwhile, pessimism has hardly budged. Bears on this survey are still only 15.5%, just 3 points above their February low and still shy of the 20% reading seen a recently as September.
The AAII survey of individual investors this week showed a further retreat in bulls (at 26.4%, they are less than half what they were at their January peak), but investors have not exactly turned bearish (bears are only 28.4%). Mostly investors have shifted to neutral (now at 45.2%, the most since mid-2016).
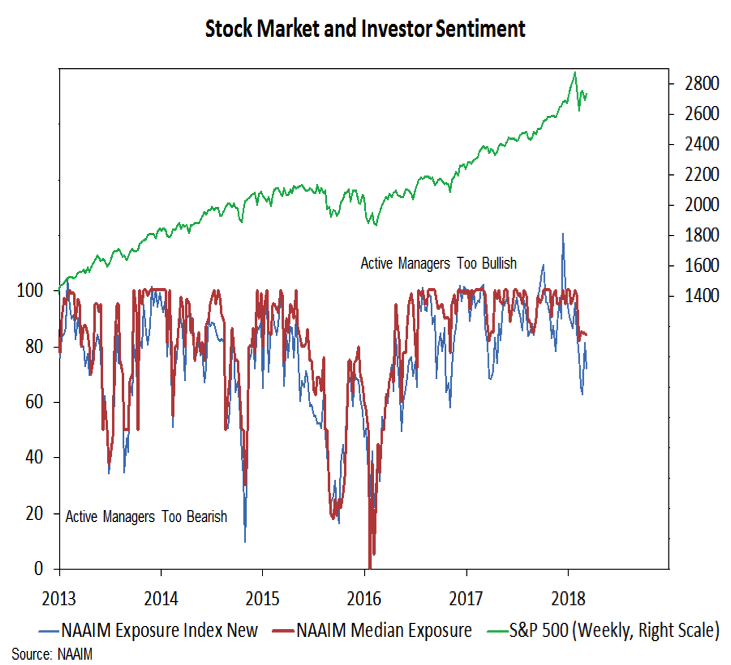
The NAAIM survey of active investment managers shows that optimism has retreated from its peak whether we look at the exposure index or median exposure (which has been more stable of late). The exposure index dropped to 72% this week while median exposure was little changed at 84%. Readings below 50% on either of these would suggest optimism is giving way to pessimism.
From a longer-term perspective, elevated valuations and household balance sheets that show near-record exposure in equities reflect deeply seated optimism and a lack of fear/concern for stocks.
Twitter: @WillieDelwiche
Any opinions expressed herein are solely those of the author, and do not in any way represent the views or opinions of any other person or entity.


