The stock market continues to take traders for a ride… while wearing out the bulls.
Perhaps that’s our contrarian cue that the S&P 500 (NYSEARCA: SPY) is nearing a bounce/rally. Market cycles seem to agree.
Stock Market Summary Analysis:
– The stock market fell last week, with the S&P 500 (SPX) down 104 points to 2632, a decline of nearly 4%.
– Also, crude oil and bitcoin lost value in the double digits as traders took risk off the table, with the global economy slowing down.
– Our projection this week is for the SPX to decline into midweek, before bouncing higher as a new minor cycle begins.
S&P 500 Market Cycle Outlook for the Week of November 26, 2018:
Coming into last week, Vice President Mike Pence made strong comments that may have led some investors to believe that the trade war between China and the United States was not necessarily approaching resolution.
“The U.S. will not change course until China changes its ways,“ explained Pence at the Asia-Pacific Economic Cooperation Forum in Papua New Guinea. US equity futures opened lower on Sunday afternoon and spent the next two days sinking further.
Also, Apple (AAPL) is having issues selling thousand-dollar phones, as I pointed out in the latest Market Week show. The stock lost another 11% last week, after reports from its suppliers that it was cutting orders for components of all of the new iPhone models.
Bitcoin lost 24% on the week, which was the second leg lower for the cryptocurrency after having peaked at nose-bleed levels earlier this year. Last week’s downtick made semiconductor-fueled Bitcoin mining operations less profitable, which helped push the Vector Semiconductor Fund (SMH) lower by 3.5%.
Crude oil also tanked last week, falling over 10% after a brutal Friday. The heavy selling was a result of concerns about a supply glut amidst a weakening global economy. OPEC will consider putting limits on the production of its members at its meeting in early December.
S&P 500 (SPX) Daily Chart
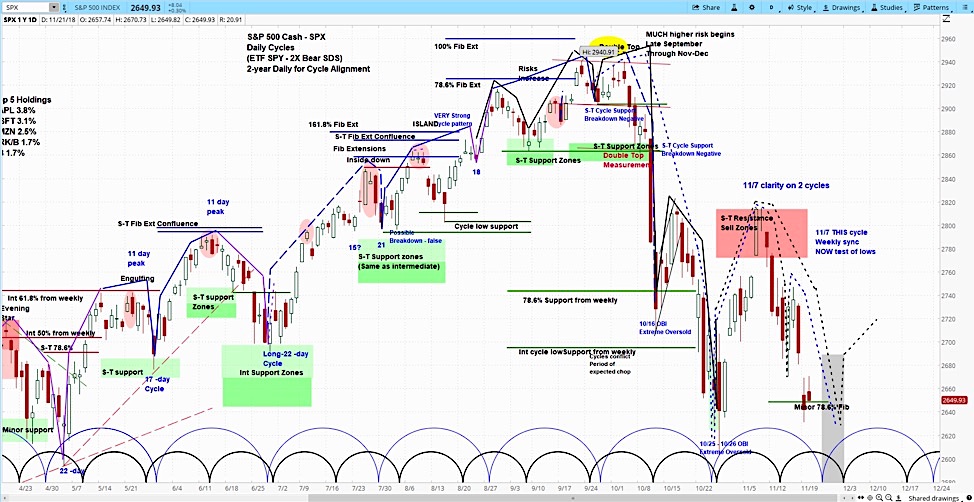
Each week we engage in the often thankless task of projecting price action for the coming week. Our approach to technical analysis focuses on time-based market cycles.
Our analysis of the S&P 500 is for stocks to continue to show weakness, targeting the “nested low” period that connects the minor cycle with the intermediate term cycle. This period is shown in gray in the chart above.
The SPX is currently trading in our support zone, which bottoms at around 2600. We see continued weakness into the middle of next week, before the market bounces higher.
For more from Slim, or to learn about cycle analysis, check out the askSlim Market Week show every Friday on our YouTube channel.
Twitter: @askslim
Any opinions expressed herein are solely those of the author, and do not in any way represent the views or opinions of any other person or entity.


