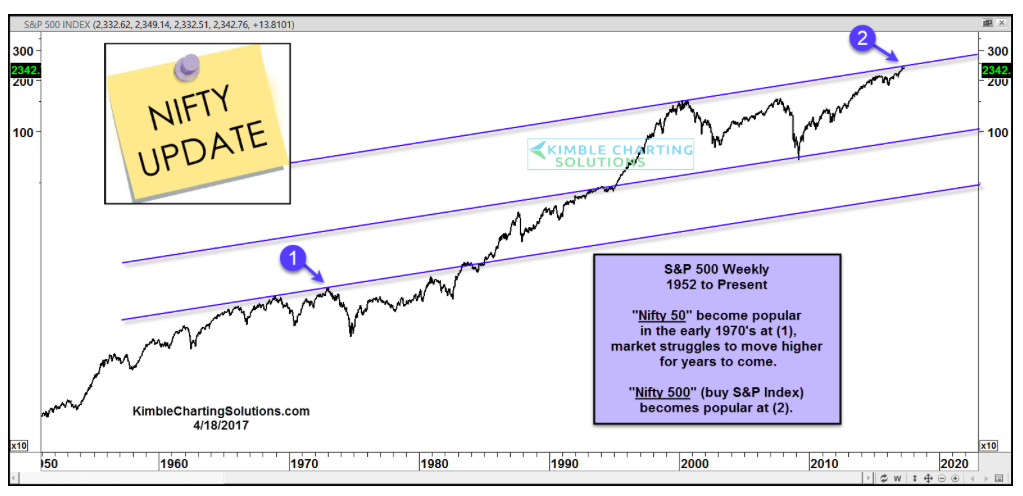
“Buy these 50 stocks and that’s all you need”. That was the early 1970’s as the stock market bounced back from a deep correction to make new highs (point 1 on the chart below).
Those 50 stocks were dubbed the “Nifty 50“. And investing in them felt like a fool-proof plan at the time.
Well, today’s stock market is beginning to feel a bit like that. And, in the case of the S&P 500 (INDEXSP:.INX), price is facing a similar line of resistance (point 2). In both instances, long-term channel resistance is being tested (see the chart below).
It was 50 stocks back then, just add a “0” today and make it the nifty 500?
S&P 500 Long-Term “Weekly” Chart
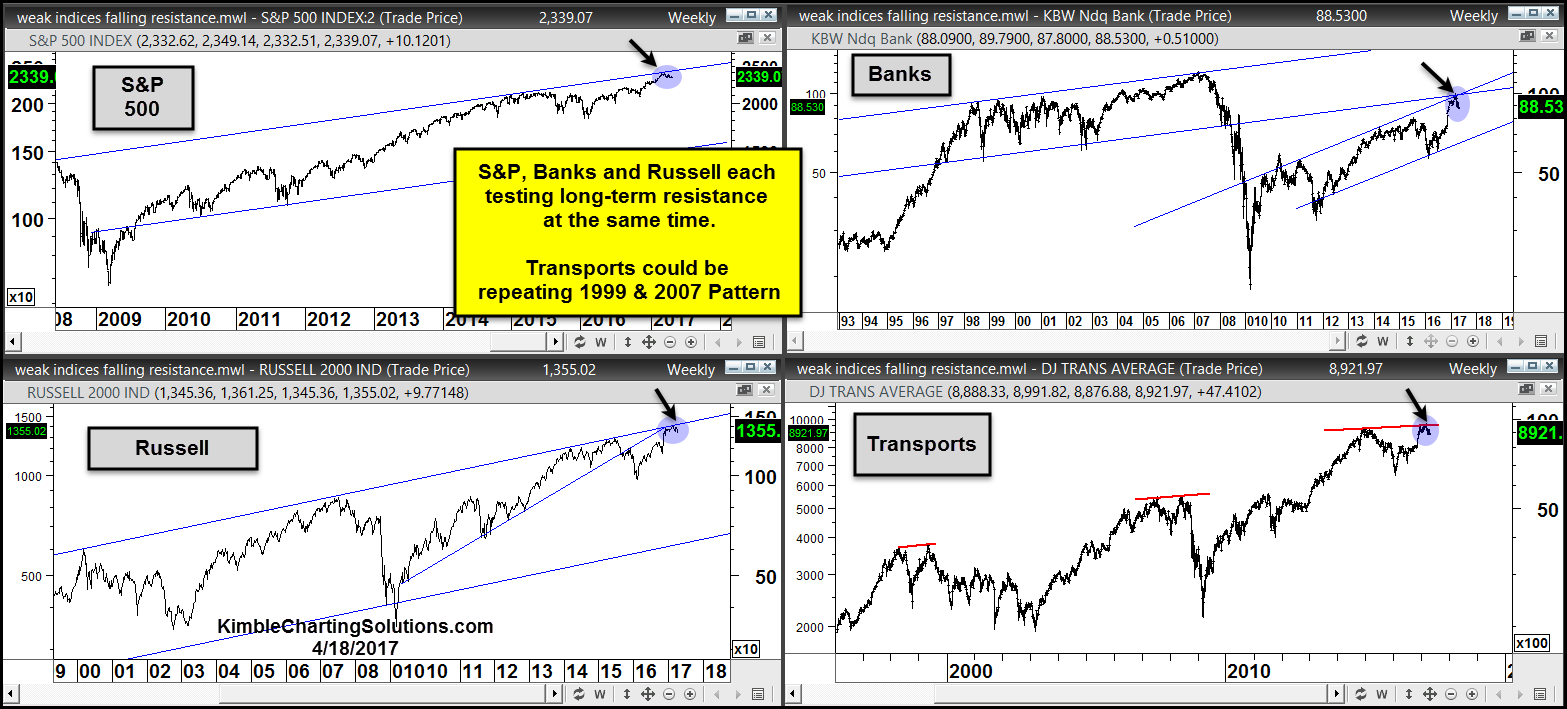
A clear decisive price move above resistance would be very bullish. But it’s worth noting that several key stock market indices are facing similar long-term resistance… and each has shown weakness at first blush. Worth keeping an eye on in my humble opinion!
Thanks for reading and good luck out there!
ALSO READ: Russell 2000 “Doji Star” Formation Concerning
Twitter: @KimbleCharting
Any opinions expressed herein are solely those of the author, and do not in any way represent the views or opinions of any other person or entity.


: Showing Some Signs of Emerging Strength")
