Investors are riding the Goldilocks wave higher, as a soft economy is being helped by a dovish Federal reserve.
This newfound optimism is being supported by our long-term stock market forecast that is built around market cycles. Those cycles are turning bullish for the coming months.
Last week, the S&P 500 (INDEXSP: .INX) rose by 63 points last week to 2950, an increase of 2.2%. Our projection this week is for stocks to pullback but then for the recent bullish momentum to continue.
The stock market surged higher last week with investors expressing their optimism for lower interest rates, as I pointed out in the latest Market Week show.
While the Federal Reserve left interest rates unchanged on Wednesday, they did signal an openness for lower rates in the future. Chair Jerome Powell explained that, “Many participants now see the case for somewhat more accommodative policy has strengthened.”
This week we will share a broader analysis on the S&P 500, which will provide a peek into our long term stock market forecast. In a nutshell, we are now bullish on stocks for the near to intermediate term. This may surprise some readers, but the question is why did we change from bearish to bullish?
Watch this week’s stock market video – Week of June 24 (and see charts and analysis below)
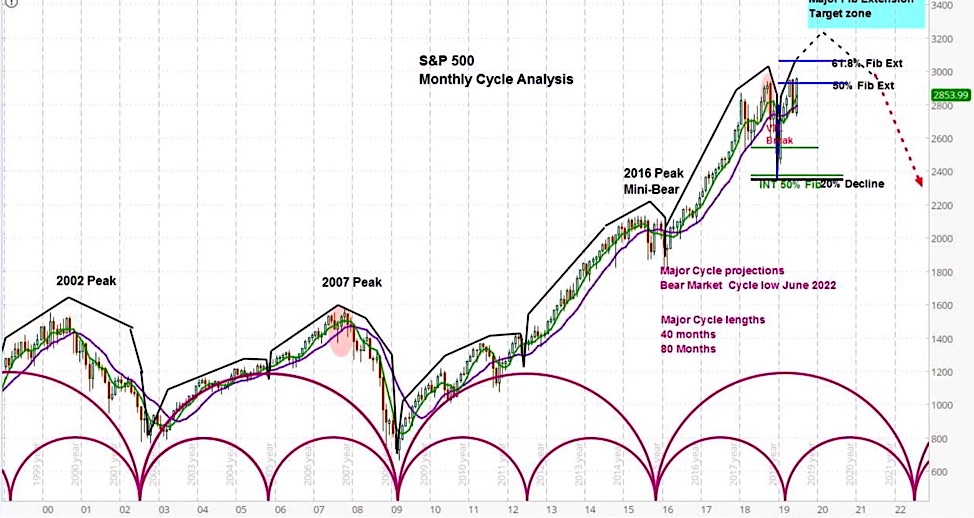
S&P 500 (SPX) Monthly Chart
Our approach to technical analysis uses market cycles to project price action. We normally share the monthly chart above with our members on a periodic basis. We include it here today to highlight how our shift in perspective is connected to cycles in multiple timeframes. Here’s the long term stock market forecast for the S&P 500.
Please note the stock market cycles dating back to 2000, in which you can see the 2002 peak, the 2007 peak, and the 2016 “mini-bear”. We believe the latter was the result of the cycle being “swamped” by strong upward momentum.
Each of these cycles is composed of two minor cycles which are “nested” within the larger cycle. Moving forward, we have just concluded the declining phase of a minor cycle, early in the rising phase of the next minor cycle. We expect at least a few months of bullish action, possibly more.
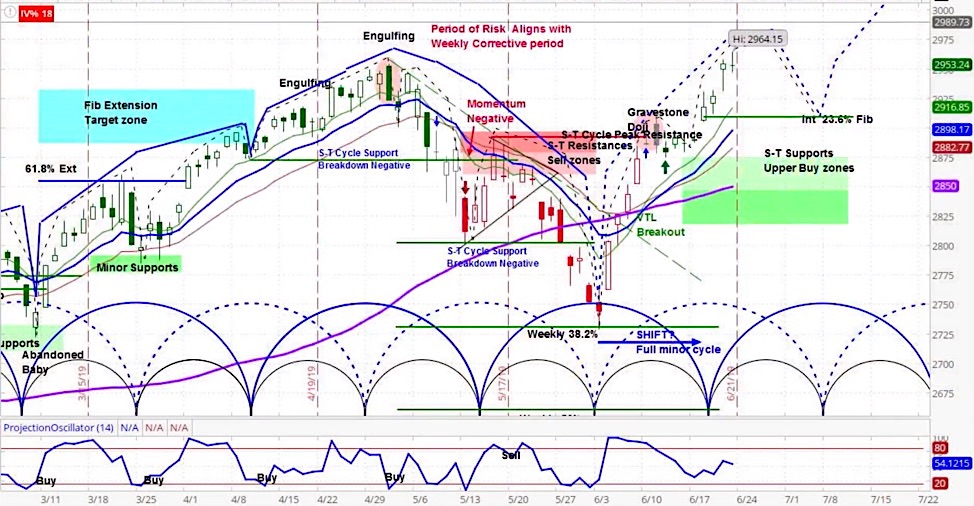
S&P 500 (SPX) Daily Chart
Moving onto the shorter term daily chart, we consider the most likely price action for the coming week. Based on the dotted market cycle that “shifted” a couple weeks ago, we expect the declining phase to occur within the next week and a half.
Given the recent strong momentum, we expect this correction to be minor, perhaps coming back to touch the 23.6% Fibonacci retracement. As such, our target for the next week-plus is for a pullback to around the 2910 area. However, in past periods of strong momentum, as we see now, minor corrections have been even more shallow than the one projected here. After that, we expect the bullish price action to continue.
For more from Slim, or to learn about cycle analysis, check out the askSlim Market Week show every Friday on our YouTube channel.
Twitter: @askslim
Any opinions expressed herein are solely those of the author, and do not in any way represent the views or opinions of any other person or entity.


