The month of September ushered in some volatility to the stock market… volatility we had not seen in quite a while.
Perhaps it will continue into October. And perhaps there is a reason.
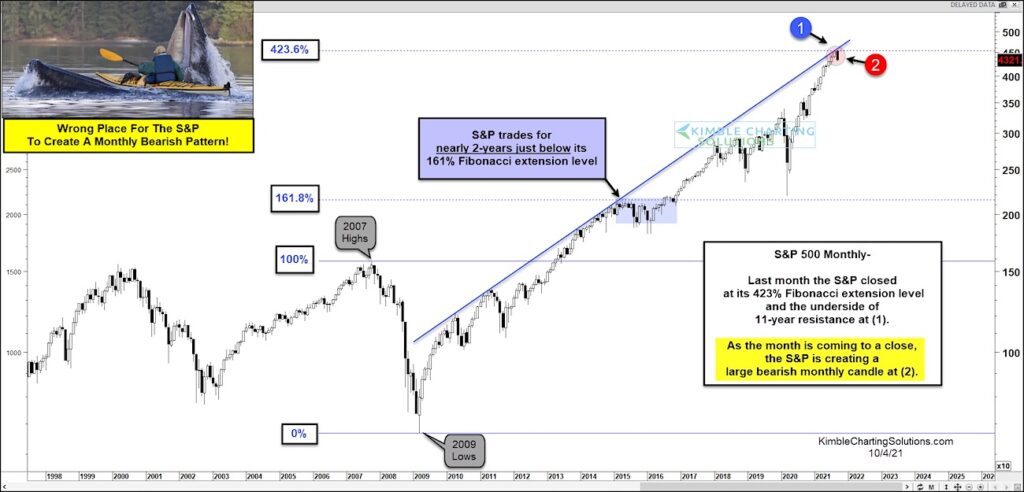
Today we take a look at a long-term “monthly” view of the S&P 500 Index.
As you can see, the S&P 500 has been in an up-trend for over a decade. And this August, the Index closed the month at its 423.6% Fibonacci extension level at (1). That closing also coincided with the underside of 11-year resistance.
The last time the S&P 500 hit a key Fibonacci extension level (161.8%), it also was testing the underside of this very same resistance… and it lead to a 2-year pullback / stakeout.
The 423.6% Fib test in August was followed up with a large bearish monthly candle in September at (2). Follow through selling in October wouldn’t be a good sign.
Wrong place, wrong time for this pattern in the S&P 500? Stay tuned!
S&P 500 Index “monthly” Chart
Note that KimbleCharting is offering a 2 week Free trial to See It Market readers. Just send me an email to services@kimblechartingsolutions.com for details to get set up.
Twitter: @KimbleCharting
Any opinions expressed herein are solely those of the author, and do not in any way represent the views or opinions of any other person or entity.


