The stock market selloff has stabilized a bit over the last few days, but we still haven’t seen any real signs of strength.
Unless something changes, the markets are on track to close down for the fourth straight week. Thus, the trend remains bearish and not much to bet on a rebound.
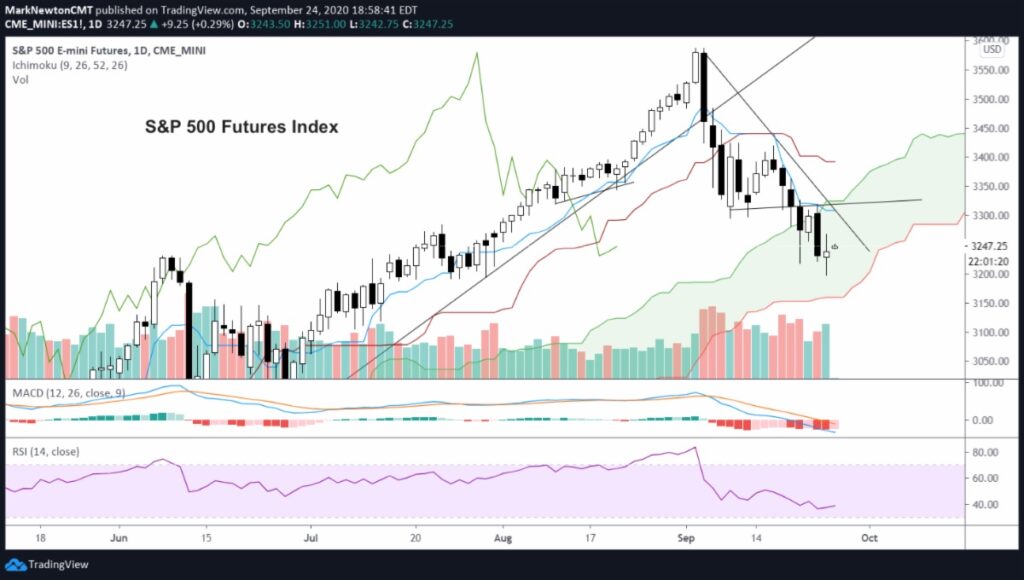
Early week selling on the S&P 500 Index lead to a flush and new multi-week lows. Those weekly lows are being tested ad trying to hold steady heading into Friday. This could very well lead to a possible bounce into month-end before the selloff reasserts itself. However, there just hasn’t been any real technical progress made to suggest markets are there just yet.
Betting on a rebound within a deep downtrend without any real Demark signals of exhaustion and/or trendline breaks doesn’t make much sense for now. As well, nearly half of the Sector ETFs are now at new monthly lows and haven’t rebounded enough to repair the trend damage caused over the past week. Key price levels to eye on the S&P 500 Index for a possible bounce are 3320. Until this is exceeded on a daily close, it makes sense just to sell into gains.
The one thing to watch is the extent that a selloff might be baked into investor sentiment already. Many are aware of election year tendencies, as well as the current state of uncertainty about the election. That said, sentiment polls released Thursday don’t really do the bearish view much justice after several months of market gains.
While the individual remains understandably somewhat more guarded than institutions, it’s thought that the dispersion of thinking has actually gotten more varied in recent weeks, if the recent NAAIM survey is any guide. AAII sentiment was similar to recent weeks, slightly more bears than bulls, while Investors intelligence polls have waned a bit , but still a 32% positive spread between Bulls and Bears. Keep in mind that Tech stocks erased 15-20% and this spread has barely budged. Thus, it’s not seen as overly fearful by any stretch, but has begun to converge, which Im thinking likely accelerates in October.
Five key themes worth highlighting:
1) Technology has snapped lower vs the broader market in a rapid mean reversion reversal which kicked off last week. Additional Tech weakness likely
2) Treasury yields might prove muted in the next 4-6 weeks, but look to be trying to bottom out and might extend rallies after October
3) US Dollar rally might hurt EM, but for now, inconclusive breakdowns in the EM space v Developed markets
4) Breadth has tailed off “big-time” with more than 5 occurrences in the last few weeks of more Decliners than Advancing issues
5) Cyclical time of importance starts in September, leading indices lower while implied volatility spikes- 20, 30 and 60 year cycle show above-avg weakness
If you have an interest in seeing timely intra-day market updates on my private twitter feed, please follow @NewtonAdvisors. Also, feel free to send me an email at info@newtonadvisor.com regarding how my Technical work can add alpha to your portfolio management process.
Twitter: @MarkNewtonCMT
Author has positions in mentioned securities at the time of publication. Any opinions expressed herein are solely those of the author, and do not in any way represent the views or opinions of any other person or entity.


