About a month ago, when the S&P 500 had completed its 6% pullback in September and was once again making new all-time highs, I shared what I would need to see to turn less bullish on the equity markets.
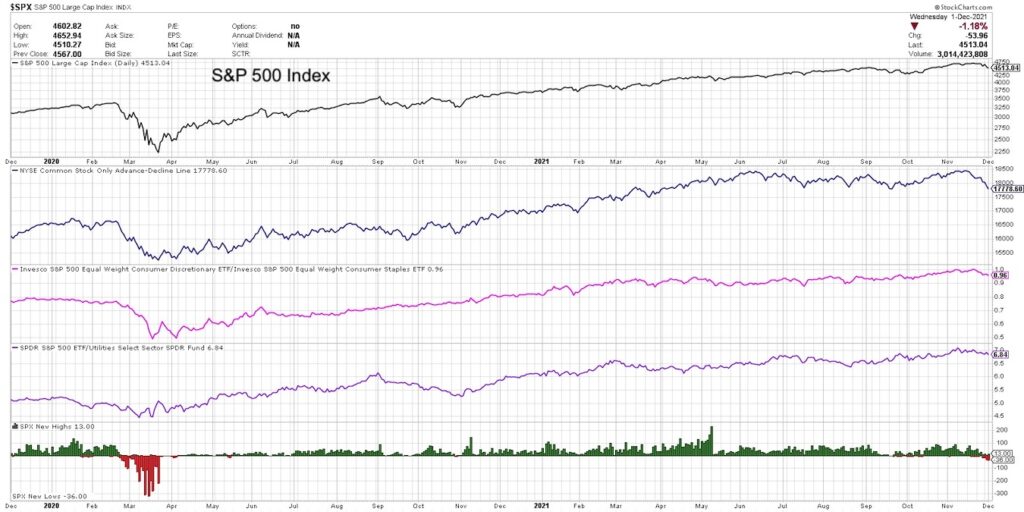
We reviewed my favorite breadth indicator, the NYSE cumulative advance-decline, along with other breadth readings and ratios that help identify when market conditions have shifted.
In today’s video, we update this perspective four weeks later and demonstrate how the indicators have rotated from “quite bullish” to “decidedly mixed”. I’ll also share my Market Trend Model and discuss how to relate the short-term down move we’ve experienced with the long-term secular bull market phase.
– What can we use to determine when investors are getting way more defensive in their positions?
– How do market breadth conditions compare now versus early November when the S&P was making new all-time highs?
– What “line in the sand” price level should investors be watching on the S&P 500 chart, and how can we confirm a new downtrend phase?
Ready to upgrade your investment process? Check out my free course on behavioral investing!
(VIDEO) Is the S&P 500 Turning Bearish?
S&P 500 Index with Market Breadth Indicators Chart
Twitter: @DKellerCMT
The author may have positions in mentioned securities at the time of publication. Any opinions expressed herein are solely those of the author, and do not in any way represent the views or opinions of any other person or entity.
Twitter: @DKellerCMT
The author may have positions in mentioned securities at the time of publication. Any opinions expressed herein are solely those of the author, and do not in any way represent the views or opinions of any other person or entity.


