S&P 500 Index Trading Outlook (3-5 Days): Long bias until 3090 is violated
It is right to continue to move up stops and respect this trend until we see a reversal. No evidence of a weak close Monday- While stretched, it’s right to respect the strength.
The S&P 500 has wildly exceeded expectations, as mean reversion has continued and many of the weaker sectors have begun to trade higher in recent weeks.
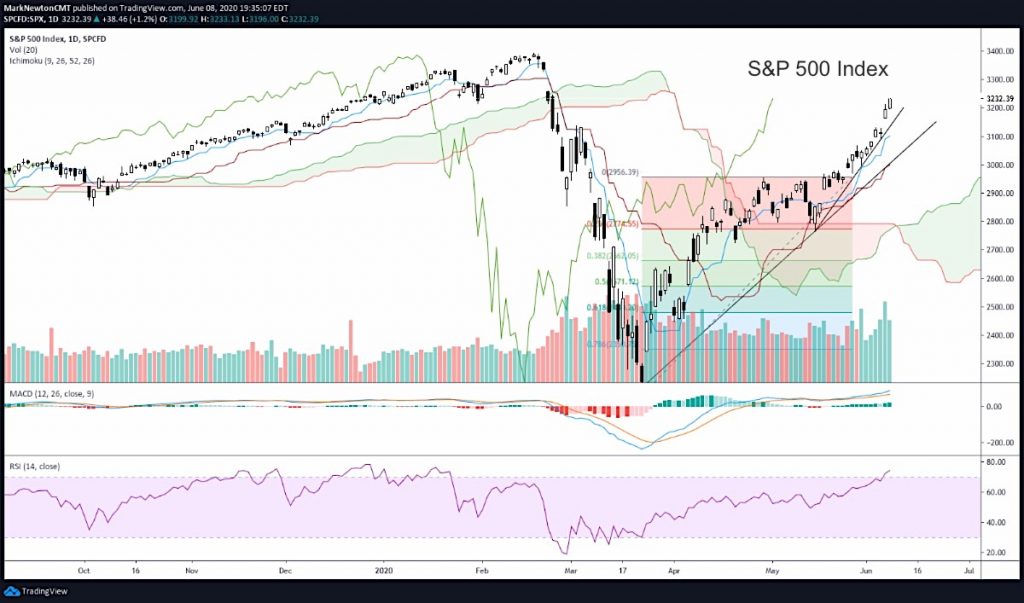
The near-term spike has turned parabolic compared to its regular trend since mid-May.
Some definite evidence of speculation is now evident, with extraordinarily low Equity Put/call ratios while huge volume flowed into Advancing v Declining issues Monday.
Meanwhile, Technology still lagged sectors like Industrials which has been led by the skyrocketing Airlines and stocks like BA which have more than doubled since March. Some selectivity is necessary here, but until signs of weakness arise, either by prices closing well off earlier highs, or evidene of trend breaks are apparent, it will be right to still be long and simply buy dips when given the chance. There’s a much higher likelihood now of new all-time highs in SPX into late Summer before a peak.
Broad Market Commentary
The market’s rise continues to defy gravity and even when stretched, we still haven’t seen any signs of even prices closing down off their highs. That will be the initial sign that a reversal should be due. Additionally what to look for concentrates on the actual trendline being broken from mid-May lows and evidence of Demark exhaustion being confirmed. At present, still no evidence even of short-term exhaustion.
However, the one change in recent weeks centers on the low TRIN reading for Monday’s trading, as while Breadth came in at a healthy 4/1 positive, there was some evidence of volume coming in at a near capitulatory 11/1 bullish. Thus, after a lengthy rise, when we see evidence of huge volume flowing into upside vs Downside stocks, compared to the overall A/D, it often can result in temporary exhaustion.
Make no mistake though, the trend has gotten stronger in the last two weeks, despite Technology largely having lagged lately. Even with the NDX back at new highs, we’ve seen Tech not really participate, and stocks like MSFT and NFLX have been stubbornly range-bound.
So the key short-term negatives, (since it’s always right to understand what can go wrong in a sharp uptrend) have to do with 1) Technology weakness, 2) Overbought conditions (daily) 3) Demark exhaustion 4) Mean reversion trade growing stretched for the Airlines, Cruiseliners, Casinos, as the market has certainly traded lately like everything’s fine and under control. We’ll see. For not, it is right to remain bullish and just look to buy dips if given the chance in the days ahead. Some charts below will focus on market indices and what looks appealing.
If you have an interest in seeing timely intra-day market updates on my private twitter feed, please follow @NewtonAdvisors. Also, feel free to send me an email at info@newtonadvisor.com regarding how my Technical work can add alpha to your portfolio management process.
Twitter: @MarkNewtonCMT
Author has positions in mentioned securities at the time of publication. Any opinions expressed herein are solely those of the author, and do not in any way represent the views or opinions of any other person or entity.


