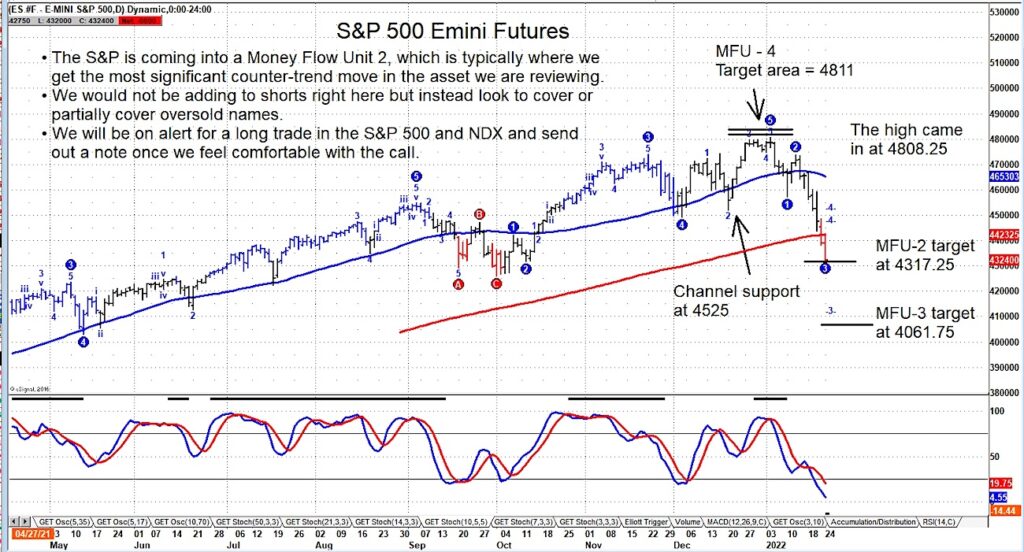
A little over a month ago, we sent out a note highlighting a reversal pattern on the S&P 500 Index (futures) where we indicated a buy signal and an MFU-4 price target near 4800. Well, the high came in at 4808.25.
The S&P 500 Index has sharply corrected from that stretched price level, falling quickly toward the 4300.
This area is marked by an MFU-2 downside price target which is typically where we see a significant counter trend move (in this case perhaps a reversal higher).
This is a good area to look for oversold stocks, even if for a trade. I wouldn’t be surprised to see a strong bounce before any selling resumes. Note that the next potential downside price target is 4061 (our MFU-3 area). But that may not be hit for weeks (if at all). We will need to continue to monitor this correction and how it plays out.
S&P 500 Index Emini Futures Chart
The author or his firm have a position in mentioned securities at the time of publication. Any opinions expressed herein are solely those of the author, and do not in any way represent the views or opinions of any other person or entity.


 Ready To Break Out?")


