Is the bull market getting long in the tooth?
Could the S&P 500 Index rally be nearing an end?
Okay now that we have the bears attention, let’s face the facts: This is a bull market (until proven otherwise). And the bull market isn’t going anywhere until we see trend lines break down.
With that being said, the stock market rally is nearing an important price juncture.
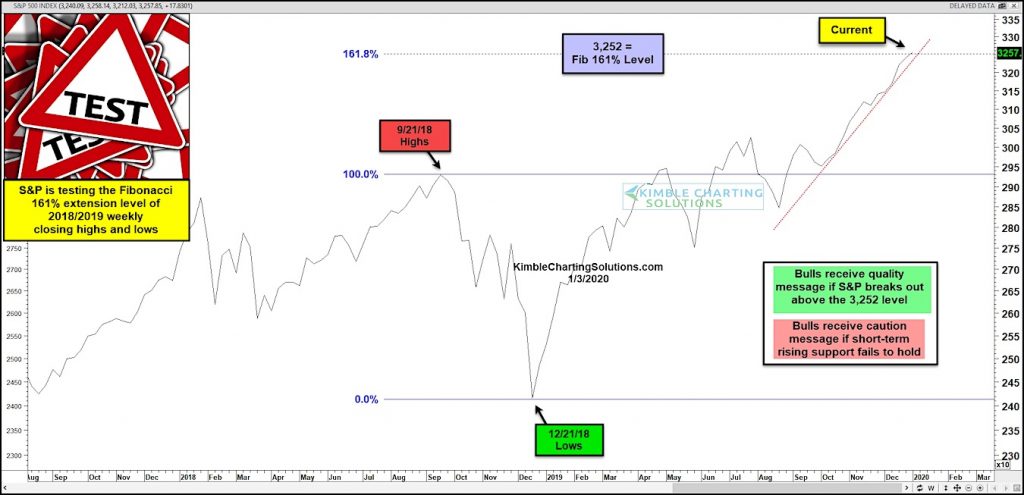
The S&P 500 is testing a key fibonacci extension price level at 3252.
This Fibonacci extension level comes from the 2018/2019 weekly closing highs and lows. A breakout above this level on a weekly basis will send a bullish message to the market, while a stalling out near this level will signal that this bull is taking a rest. Only a break down below the up-trend line will signal caution. Stay tuned!
S&P 500 Index Chart – Fibonacci Price Target
Note that KimbleCharting is offering a 2 week Free trial to See It Market readers. Just send me an email to services@kimblechartingsolutions.com for details to get set up.
Twitter: @KimbleCharting
Any opinions expressed herein are solely those of the author, and do not in any way represent the views or opinions of any other person or entity.


