S&P 500 ETF (SPY) Trading Outlook (3-5 Days): Bearish
A minor selloff looks underway for the major stock market indices. The decline thus far has been led by the Nasdaq and technology stocks like Apple (AAPL).
The S&P 500 Index pullback should last about 3-5 days, likely targeting 3162 then 3100.
The decline which started early morning in S&P 500 futures appears to have carved out 5-waves lower which after a lengthy advance from late June should be followed by additional weakness into early next week.
While uptrends at this point remain intact, one can argue that a pullback under 3200 can happen before any sort of push back to new highs can happen.
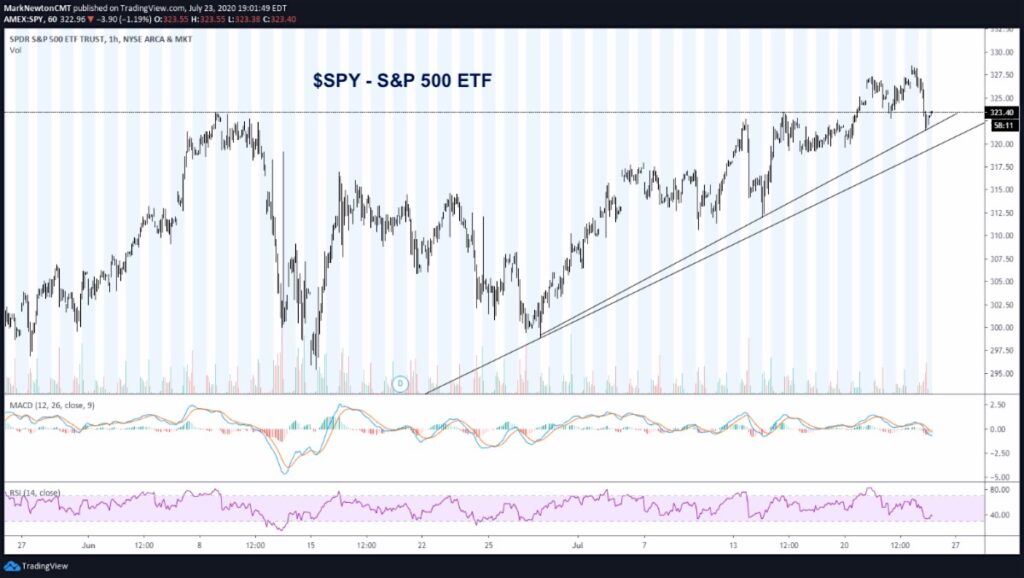
Overall, the S&P 500 showed some meaningful negative divergence on daily charts when looking at the advance from late June into late Wednesday when utilizing traditional technical indicators like RSI and MACD.
The Bottom Line: Thursday’s lows at 3222 are important. Any failure in an overnight bounce to show followthrough back above 3264 that gets back under 3222 should lead to 3165, or a max near 3100 this go-around before turning back higher into mid-August.
If you have an interest in seeing timely intra-day market updates on my private twitter feed, please follow @NewtonAdvisors. Also, feel free to send me an email at info@newtonadvisor.com regarding how my Technical work can add alpha to your portfolio management process.
Twitter: @MarkNewtonCMT
Author has positions in mentioned securities at the time of publication. Any opinions expressed herein are solely those of the author, and do not in any way represent the views or opinions of any other person or entity.


